
A headline hits, social attention accelerates, and a ticker starts appearing across multiple channels. The advantage belongs to the trader or developer who can detect, interpret, and act on that shift before their workflow becomes a bottleneck. That is where trading APIs versus data feeds becomes more than a technical distinction. It determines how quickly market information reaches your process, how much control you have over it, and whether it can support real-time decision systems.
The terms are often used interchangeably, but they serve different jobs. A data feed delivers information. An API provides a structured way for software to request, receive, and sometimes send information or instructions. For serious market research, the right setup is rarely about choosing one label over the other. It is about matching delivery, data quality, latency, and integration depth to the workflow you actually run.
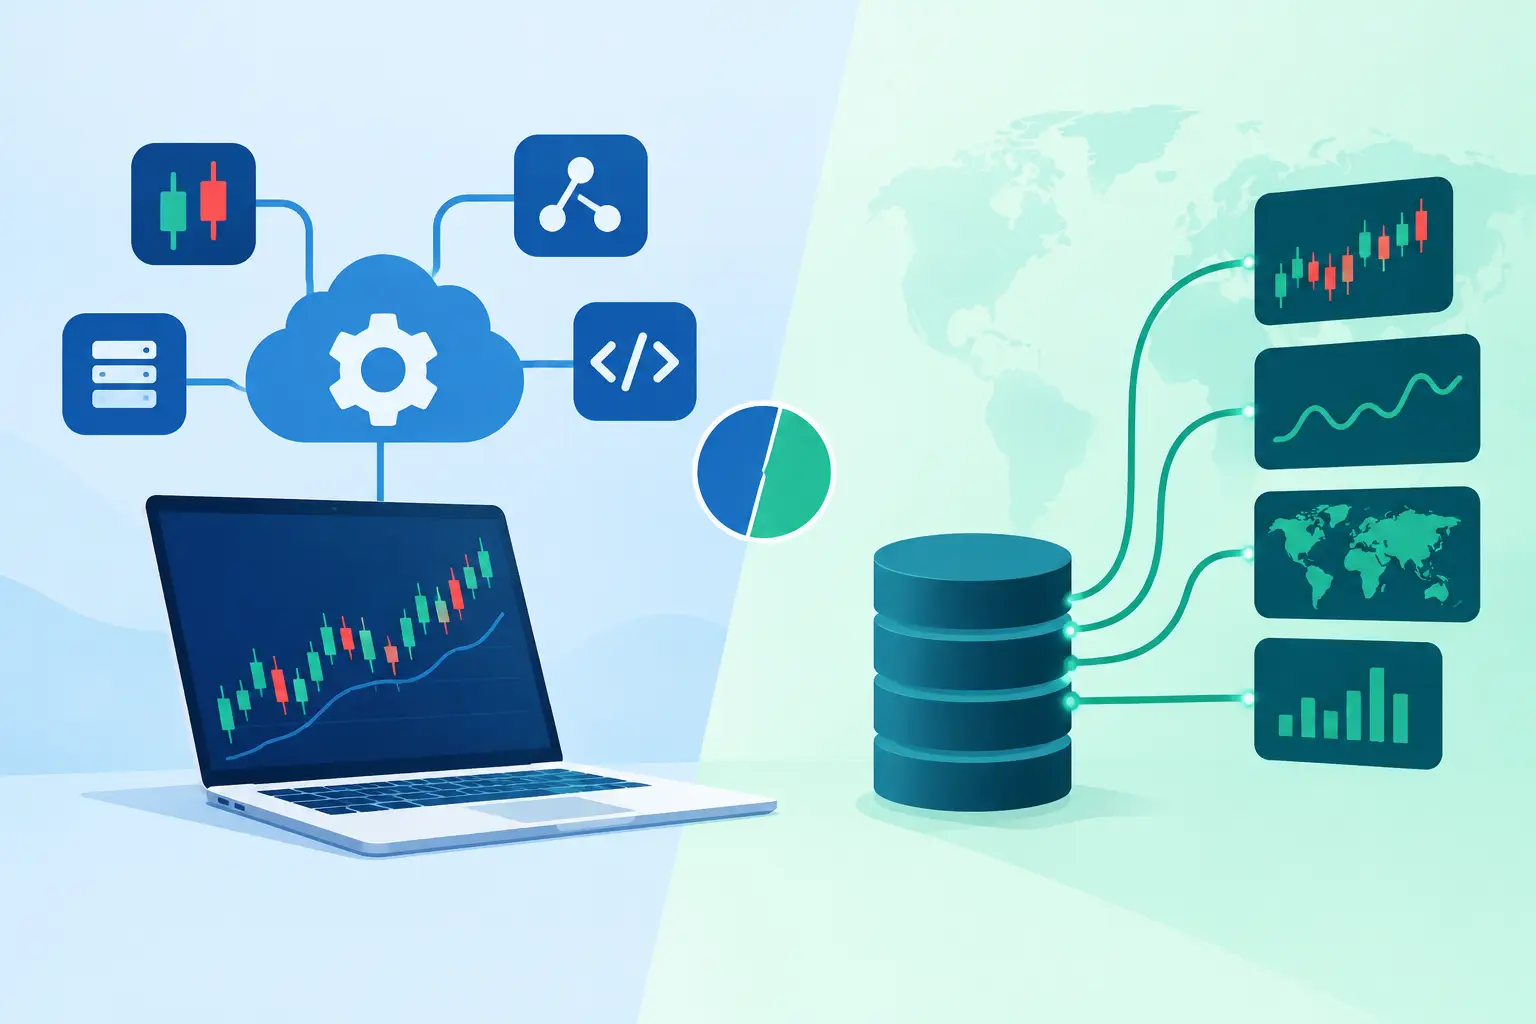
Trading APIs Versus Data Feeds: The Core Difference
A data feed is a stream or service that supplies market-related information. That can include quotes, trades, historical bars, corporate actions, options activity, news, fundamentals, social discussion, or sentiment scores. Its primary role is distribution: getting defined data from a source to a screen, database, charting environment, or model.
A trading API is an application programming interface designed to let your software interact with a market platform or brokerage infrastructure. Depending on the provider and permissions, it can retrieve account data, access pricing, submit orders, monitor execution status, or manage positions. Many trading APIs also expose market data, which is why the category can appear to overlap with feeds.
The practical distinction is intent. A feed answers, "What is happening?" An API answers, "How can my system interact with this service?" A single API can carry a data feed, but not every data feed offers the controls, endpoints, authentication, and operational capabilities of a trading API.
What data feeds are built to do
Data feeds are optimized around breadth, continuity, and timing. A market participant may need real-time updates for a watchlist, end-of-day history for a research model, or normalized news events for a dashboard. The feed is the delivery layer.
The details matter. A feed may be delayed or real-time, consolidated or exchange-specific, snapshot-based or streaming. It may include raw events with minimal interpretation, or calculated fields such as indicators, sentiment classifications, and relevance scores. Those differences directly affect what the data can support.
For example, a plain price feed can confirm movement. It cannot explain why attention is building around a ticker. A higher-level intelligence feed can add context by measuring verified news momentum, social activity, technical conditions, and evidence behind the signal.
What trading APIs are built to do
Trading APIs are designed for programmatic control. They use defined endpoints, request formats, authentication methods, rate limits, and response structures so an application can interact reliably with an external service.
For a developer, that creates a wider operating surface. The API may retrieve market data, query a portfolio, stream events, create alerts, or send execution instructions. For a trader using a custom dashboard, it can also pull external intelligence into the same environment where research and risk monitoring happen.
That added control creates added responsibility. API integrations require secure credential handling, error management, request throttling, failover thinking, and clear rules for stale or missing data. A visual feed can be enough for discretionary research. Automated systems need more than access - they need operational discipline.
Where the Comparison Actually Matters
The right choice depends less on terminology than on four questions: how fast you need information, how you intend to use it, how much customization you require, and what happens when the data is incomplete or delayed.
Latency is more than a speed claim
Low latency matters most when the value of a signal decays quickly. Fast-moving attention, breaking verified news, and unusual activity can change the market narrative within minutes. But traders should distinguish between transport latency and signal latency.
Transport latency is the time required to move a data point from provider to user. Signal latency is the time required to identify that the data point matters. A raw stream may arrive quickly while still forcing you to do the hard work of classification, scoring, and context assembly. A well-designed intelligence API can reduce signal latency by delivering a ticker-level narrative rather than a flood of disconnected events.
For swing traders and growth investors, a few milliseconds may not change the research outcome. A clear indication that news momentum and social conviction are strengthening can matter far more. For systematic workflows, both forms of latency deserve measurement.
Coverage determines your blind spots
Price and volume are foundational, but they are not the complete market. A workflow limited to traditional data can miss the attention shifts that often appear before broad participation becomes visible in volume.
Coverage should be evaluated by asset universe, historical depth, update frequency, source quality, normalization, and field-level transparency. It also means asking whether the feed captures only activity or provides context around activity. A surge in mentions is not automatically meaningful. It may be viral noise, duplicated posts, or a reaction to stale information.
The strongest research inputs separate sources instead of collapsing everything into an opaque score. Independent views of verified news, social chatter, and technical conditions give users a way to assess whether a narrative has real traction.
Integration defines your research ceiling
A dashboard offers speed for human analysis. It is often the best place to scan, validate, and compare emerging setups across a broad universe. A REST API offers flexibility for developers who want the same intelligence inside custom models, internal tools, notification systems, or quantitative research pipelines.
Neither delivery method is inherently superior. The dashboard-first user needs clarity with minimal setup. The developer needs stable schema, documentation, predictable rate limits, and data that can be stored, transformed, and tested. A platform that supports both allows the workflow to expand without forcing a change in underlying signal logic.
Choosing Between a Feed, an API, or Both
Start with the decision you need the data to support. If you are monitoring a focused watchlist and need immediate visual context, a data feed delivered through a capable interface may be sufficient. Prioritize alert quality, ticker-level evidence, filtering controls, and the ability to distinguish news-driven momentum from social noise.
If you are building a scanner, research database, model, or custom alert engine, an API becomes essential. Look beyond the endpoint list. Check whether fields are consistently defined, whether historical data supports validation, whether timestamps are clear, and whether the provider exposes the components behind calculated scores.
Many advanced workflows use both. The dashboard identifies emerging attention and gives the analyst a fast way to inspect the narrative. The API transfers selected data into a model, internal dashboard, or alert workflow. This division keeps human judgment where it adds value while allowing repeatable tasks to run systematically.
Sentimentick follows this dual-path model: a visual workspace for rapid market scanning and a developer-ready REST API for integrating ticker-level sentiment, verified news momentum, and technical context into custom workflows. The key is not simply receiving more data. It is receiving intelligence organized around the signals that deserve attention.
What to Test Before You Integrate
Before committing to any market data workflow, test it against real research conditions. Run it through active market sessions, unusual news cycles, and periods of elevated discussion. Observe whether alerts arrive with enough context to be useful and whether the system helps you narrow the field rather than adding another stream to monitor.
Evaluate data provenance closely. Can you see why a ticker was flagged? Can you separate news momentum from social momentum? Can you inspect the underlying evidence when a score changes? Transparent inputs make it easier to build conviction, tune filters, and identify when an apparent signal is merely noise.
Also test failure conditions. Streaming connections drop. Rate limits are reached. News classifications can change as stories develop. A dependable workflow needs timestamp awareness, retry logic, stale-data handling, and a process for validating unexpected outputs. Speed without reliability is not an edge.
The best market intelligence setup does not overwhelm you with events or force you to build every layer from scratch. It shortens the distance between an emerging narrative and a clear research decision, while preserving enough transparency to understand what the signal is telling you.