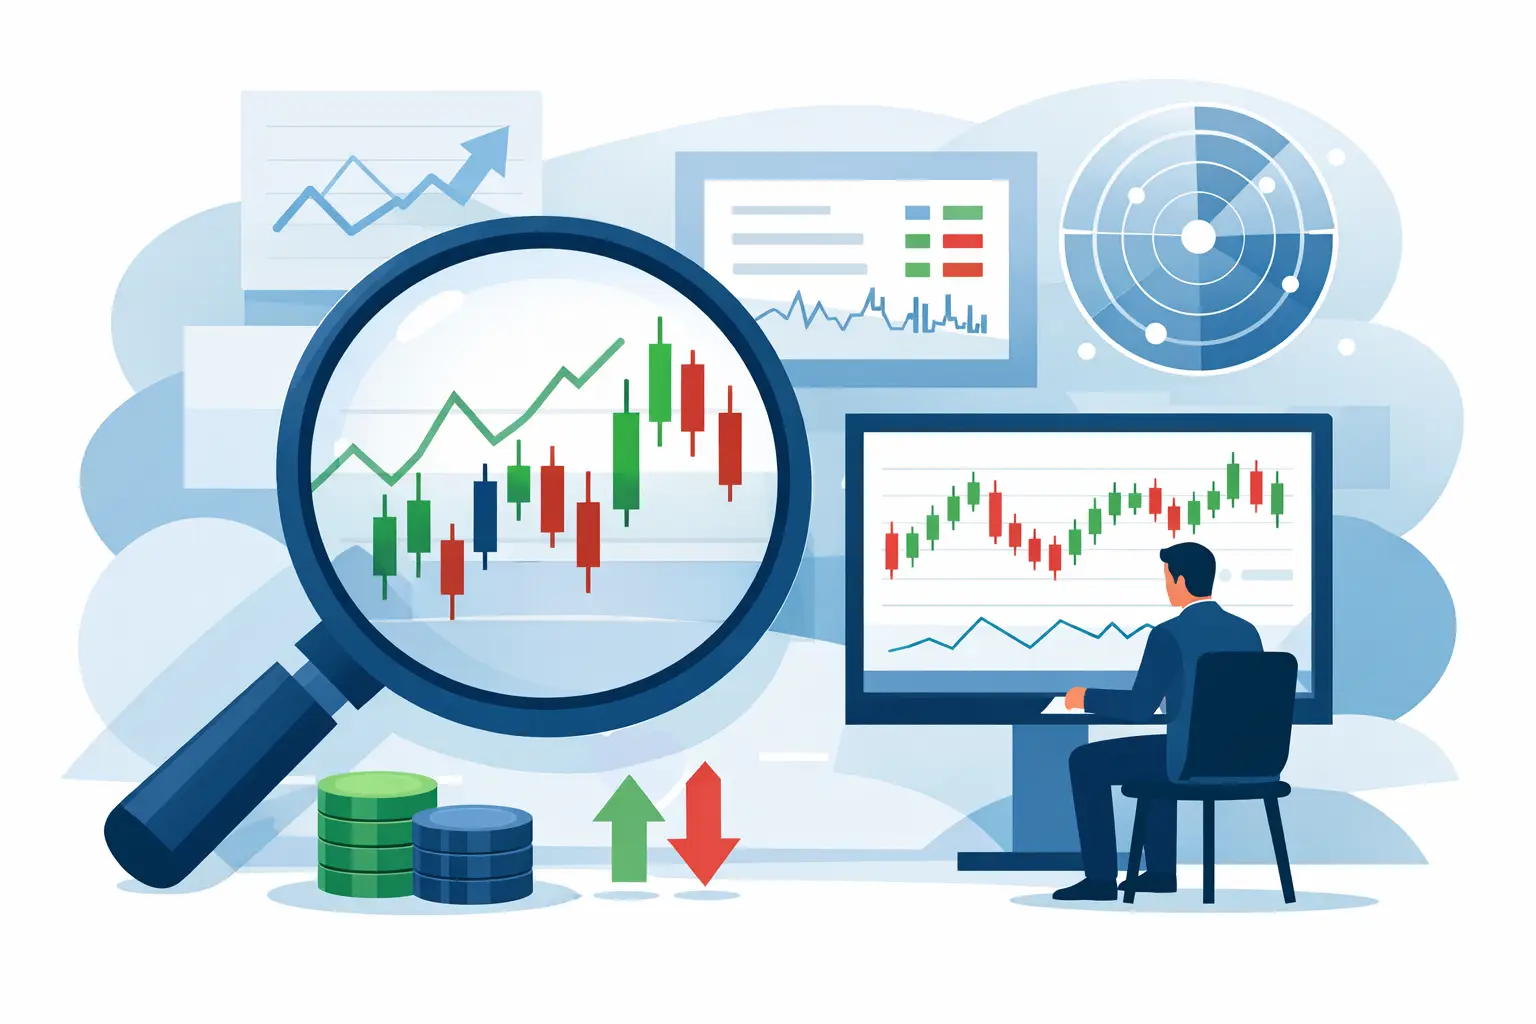
Most traders do not miss moves because they cannot read a chart. They miss them because the market starts paying attention before the chart makes that obvious. An abnormal ticker activity scanner exists for that gap. It helps you detect when a stock starts attracting unusual interest across news, social discussion, and ticker-specific narrative flow before that attention fully translates into price or volume expansion.
That matters because raw activity is not the same as meaningful activity. A ticker can trend for bad reasons, low-quality reasons, or reasons that fade in an hour. The real job of a scanner is not just to show what is moving. It is to surface what is changing, why it is changing, and whether that change is gaining traction.
What an abnormal ticker activity scanner actually does
At a basic level, this type of scanner compares current ticker attention against a historical baseline. If a stock that usually gets very little discussion suddenly shows a sharp increase in verified news mentions, social chatter, or sentiment velocity, it gets flagged as abnormal.
The word abnormal is doing the heavy lifting here. A good scanner is not simply ranking the most mentioned tickers on the market. Large-cap names are always active. If you only measure absolute volume, the same crowded names dominate the screen and you lose the point of the tool.
Instead, the scanner should ask better questions. Is attention rising faster than usual for this ticker? Is the shift happening in verified coverage, retail discussion, or both? Is sentiment improving, deteriorating, or splitting? Is the story new, or is an old theme reactivating?
For active traders, those are the questions that create usable context. You are not just looking for noise. You are looking for early evidence that market focus is rotating.
Why abnormal activity matters before price confirms
Price is the final output of many inputs. By the time a move is obvious on a chart, the underlying narrative may already be crowded. That does not mean price action stops mattering. It means there is value in seeing what the market is starting to care about before everyone else is reacting to the same candle.
An abnormal ticker activity scanner can help identify that transition period. Maybe a company starts appearing in a cluster of credible news items. Maybe a dormant small-cap suddenly receives a surge in trader attention. Maybe sentiment turns positive after weeks of indifference. None of those signals guarantee follow-through, but they can tell you where attention is forming.
That is useful because market moves are often attention-driven in their early stage. Price and volume confirm. Narrative begins earlier.
Not all abnormal activity is signal
This is where many scanners fail. They surface activity but do not help you judge its quality.
A ticker can spike because of recycled headlines, low-conviction social posts, rumor loops, or short-lived viral chatter. If your scanner treats all mentions as equal, you end up chasing the loudest data instead of the best data.
A stronger approach separates attention sources and weights them differently. Verified news momentum should not be blended blindly with anonymous social traffic. They serve different purposes. News can validate that an event is real and broadly visible. Social data can reveal speed, intensity, and retail narrative formation. When both move together, the signal often gets more interesting. When they diverge, that difference is often the story.
For example, a ticker with rising social volume but no credible news support may deserve skepticism. A ticker with accelerating verified coverage and moderate but improving social sentiment may deserve closer monitoring. The scanner is not there to make the decision for you. It is there to compress the research cycle.
What to look for in an abnormal ticker activity scanner
The best tools do more than flash an alert. They provide enough structure to help you decide whether the abnormality matters.
First, baseline comparison is essential. You need to know whether current activity is unusual relative to that ticker's own history, not just relative to the broad market. A small-cap that moves from 5 daily mentions to 80 is a very different case than a mega-cap moving from 10,000 to 11,000.
Second, source separation matters. News momentum, social activity, and sentiment should be visible as distinct layers. If they are collapsed into one score, you lose the ability to judge whether the move is grounded, speculative, or mixed.
Third, evidence visibility is critical. A scanner should not just tell you a ticker is active. It should show the actual drivers behind that activity. Which headlines triggered the change? What kind of posts are increasing? Is the language around the ticker shifting toward earnings, guidance, regulation, product news, or broader macro themes?
Fourth, time sensitivity matters. Abnormal activity is often most useful when it is fresh. If the scanner updates too slowly or relies on delayed aggregation, the edge is reduced. Traders monitoring short- to medium-term setups need live context, not a post-move report.
Finally, narrative continuity is underrated. Some of the best opportunities come not from one-off spikes but from evolving stories. A ticker may first appear because of an isolated event, then continue attracting attention as the narrative strengthens. A scanner that helps you track that progression over time is much more useful than one that only catches isolated bursts.
How traders use scanner data in a real workflow
An abnormal ticker activity scanner is most effective when it sits near the top of your research stack, not at the end.
A practical workflow starts with detection. The scanner flags a name showing unusual attention relative to normal behavior. From there, the next step is validation. You check whether the move is being driven by verified news, social speculation, or a combination. Then you assess narrative structure. Is this a one-headline event, or is the market building a broader theme around the ticker?
After that, the scanner helps with prioritization. Most active traders do not need more tickers. They need fewer, better names to investigate. If five names show unusual volume but only one is also showing accelerating narrative momentum and improving sentiment quality, that name likely moves higher on the watchlist.
This is where platforms like Sentimentick fit naturally. The value is not just surfacing outliers. It is packaging the abnormality into evidence-backed context that can be reviewed fast. That is a very different experience from scrolling raw feeds and trying to guess what matters.
Common mistakes when using abnormal activity screens
The biggest mistake is treating every alert as opportunity. Abnormal activity only tells you something changed. It does not tell you the change is durable, tradeable, or directionally clear.
Another mistake is overvaluing social volume without checking source quality. Retail attention can matter, but only when you understand whether it is coordinated excitement, genuine discovery, or low-effort repetition. Volume alone is weak context.
Traders also get into trouble when they ignore ticker personality. Some stocks are naturally noisy. Others barely register unless something real is happening. An identical percentage spike in attention means different things across different names.
Then there is timing. Early signal is useful, but early does not always mean immediate. A narrative can start building long before price fully reacts. If you expect instant confirmation from every scanner hit, you will misread how information develops in the market.
Scanner output is better when it includes narrative intelligence
The highest-value abnormal ticker activity scanner does not stop at anomaly detection. It helps explain the anomaly.
Narrative intelligence adds a layer that raw scanners usually miss. It shows whether attention is concentrated around one event or broadening into a more durable market story. That distinction matters. A headline can create a quick spike. A narrative can sustain focus across sessions.
This is especially relevant in a market where information spreads unevenly. Verified outlets, niche financial communities, and fast-moving trader conversations all interact differently. A scanner that tracks those channels separately gives you a cleaner picture of how market attention is forming.
That is why the strongest setups often begin with asymmetric awareness. A story is visible, but not fully crowded. An abnormal activity alert tells you where to look. Narrative tracking tells you whether the story is strengthening, fragmenting, or fading.
What this tool is really for
An abnormal ticker activity scanner is not a shortcut around research. It is a speed layer for research. It helps you narrow the field, catch emerging attention sooner, and focus your analysis on tickers where the market's interest is changing in a measurable way.
For active traders, that is a meaningful edge. The market does not announce when a stock is about to become important. It leaks attention first. The better your scanner is at identifying abnormal attention and separating signal from noise, the faster you can find the names worth your time.
And in a crowded market, time is usually the scarcest asset on the screen.