
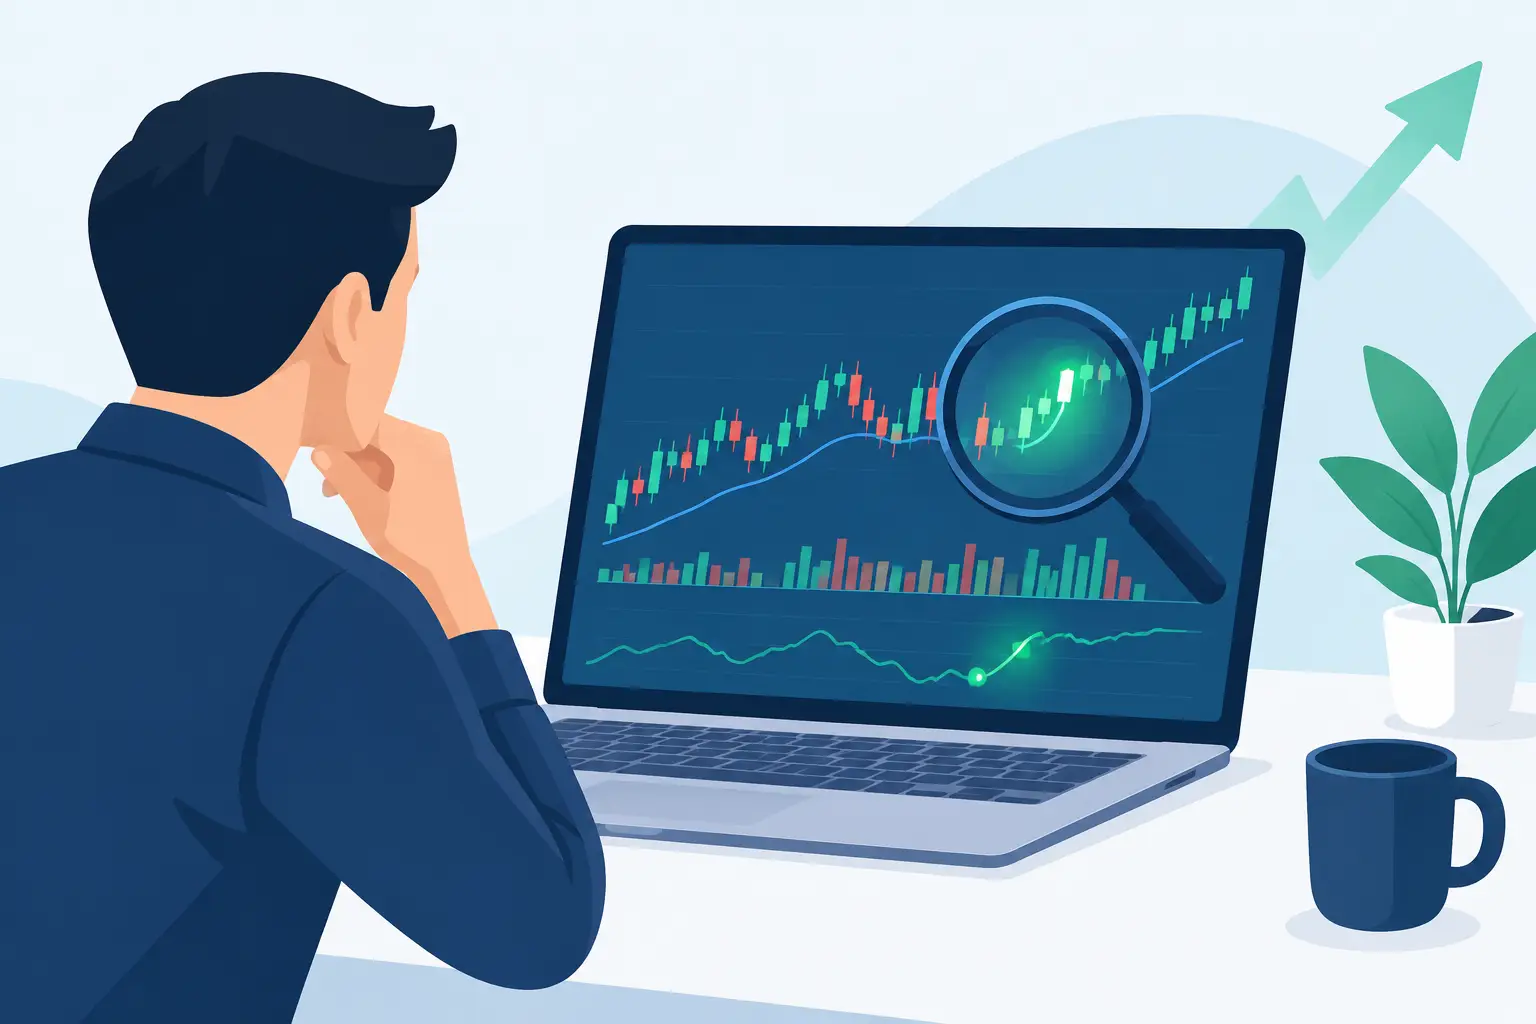
A chart can show that a move happened. A strong stocks analysis tool helps explain why attention is building before the chart becomes obvious. That distinction matters when hundreds of tickers compete for attention and the market reprices narratives faster than any manual watchlist can handle.
For active traders and research-driven investors, the objective is not more data. It is earlier, cleaner context. The right workflow identifies where attention is accelerating, whether that attention is credible, and how price behavior confirms or challenges the developing narrative.
What a Stocks Analysis Tool Must Do
Most market platforms can display a chart, a news headline, or a social mention count. Those inputs become useful only when they are evaluated together without being blended into one opaque score.
A meaningful stock analysis system separates the signals that drive market attention. Verified news has a different weight than casual online discussion. A sudden increase in social chatter can expose a developing theme, but it does not carry the same evidentiary value as a filing, earnings update, contract announcement, regulatory decision, or analyst-relevant business event. Technical data adds a third layer: it shows whether market participants are acting on the narrative.
The goal is not to treat every burst of activity as a tradeable event. It is to quickly distinguish a real shift in market perception from recycled headlines, isolated speculation, or a ticker temporarily caught in a broader trend.
A capable system should answer four questions at the ticker level:
- What is driving new attention right now?
- Is the attention coming from verified information, social momentum, or both?
- Is the signal accelerating, fading, or repeating?
- Does price and volume behavior support the narrative?
When those answers live in separate tabs, research slows down. When they appear in one evidence-backed view, a trader can move from discovery to informed judgment with far less friction.
Signal Intelligence Beats Raw Attention
Raw mention volume is easy to measure and easy to misread. A ticker may trend because of an old story resurfacing, a viral post with little substance, a broad sector move, or a genuinely material catalyst. Treating each event equally creates noise precisely when speed matters most.
Signal intelligence focuses on change, quality, and confirmation. A useful system tracks whether discussion is rising relative to a ticker's own baseline, not just whether the absolute count is high. A small-cap name receiving 500 new mentions may represent a major attention shift. For a mega-cap, that same number may be irrelevant.
The same principle applies to news. Five duplicate articles do not equal five independent catalysts. Research tools should recognize source quality, recency, and the underlying event so users can see whether a narrative has fresh evidence behind it.
Technical context prevents the analysis from becoming purely conversational. Attention may surge while price remains contained, signaling early interest without market confirmation. In other cases, a sustained technical breakout arrives with little public discussion, suggesting the price move may be leading the narrative. Neither condition automatically dictates an action. Both are valuable because they tell you where to investigate next.
Independent Signals Create Better Judgment
Combining news, sentiment, and technicals is not the same as collapsing them into a single black-box rating. A composite can be useful for ranking, but it should never hide the evidence that created the rank.
Independent signal views let users judge alignment. Consider a ticker with rapidly increasing verified news momentum, positive social acceleration, and improving relative strength. The convergence is more informative than any one input alone. Now consider a ticker with explosive social activity, no new verified development, and weakening price structure. That is a different research case, even if the ticker appears near the top of an attention list.
Transparent evidence feeds make this distinction operational. Instead of accepting a score at face value, traders can inspect the headlines, discussion patterns, technical changes, and timestamps behind it. That keeps the tool useful during fast markets, when stale or duplicated information can create expensive confusion.
Build a Faster Research Workflow
The strongest workflow starts with screening, not searching. Searching begins after you already know the ticker. Screening surfaces names that have earned attention before they make it onto every market recap.
Start by defining the behavior you want to detect. A momentum-focused trader may look for tickers with rising news velocity and unusual social engagement alongside expanding volume. A growth-oriented investor may prioritize sustained narrative improvement, repeated high-quality news developments, and technical resilience over a longer period. A systematic researcher may filter for measurable changes in sentiment and export the data into a custom model.
The screen should narrow the universe to a manageable set of outliers. From there, move through a disciplined review sequence.
First, inspect the catalyst. Is there a new, verifiable event, or is the conversation attached to something already known? Read the evidence trail rather than relying on a headline label. Timing matters: a catalyst from two hours ago carries a different implication than one that was first reported several days ago.
Next, inspect the attention pattern. Is discussion concentrated around one source, or is it spreading across independent participants? Is sentiment consistently improving, or are polarized reactions producing a misleading average? A sharp increase in activity is most useful when you understand what changed beneath the number.
Then place the signal against price and volume. Look for confirmation, divergence, and timing. Price may already reflect the narrative, may be beginning to respond, or may be rejecting it. The purpose is not to force agreement among every signal. It is to identify the disagreement early enough to avoid making assumptions.
Finally, set an alert around the condition that would change your view. That could be a new verified headline, a renewed acceleration in discussion, a technical level interaction, or a shift in relative volume. Good alerts are specific. “Tell me when this ticker moves” creates noise. “Tell me when verified news momentum rises again while social attention exceeds its recent baseline” creates a research trigger.
Why Alert Design Determines Tool Value
A market tool can have excellent data and still fail its user if it sends alerts without hierarchy. Traders do not need another stream of pings. They need a way to prioritize what deserves attention now.
The best alert logic is tied to inflection points rather than static conditions. A fixed mention threshold may be useful for a heavily followed name but meaningless for a less active ticker. Relative change is often more valuable: an unusual acceleration versus a ticker's normal behavior, especially when it appears alongside a fresh news event or meaningful technical change.
Alerting should also reflect the user's time horizon. A short-term momentum workflow needs fast notifications and intraday context. A multi-week research process may care more about sustained shifts in narrative quality, repeated confirmation, and changes in trend persistence. One default setting cannot serve both well.
This is where a unified dashboard earns its place. It gives discretionary users a fast visual read on the developing story, while a developer-ready API can deliver structured sentiment, news, and technical inputs into custom dashboards, models, or automated monitoring systems. The core advantage is consistency: the same ticker-level intelligence can support different workflows without forcing everyone into the same interface.
Common Mistakes When Evaluating Market Signals
The first mistake is confusing visibility with significance. A ticker can be everywhere online and still lack a new fundamental or market-relevant development. Attention is a lead worth investigating, not proof of a durable narrative.
The second is treating sentiment as a prediction. Sentiment measures the direction and intensity of market conversation. It can reveal crowding, emerging conviction, skepticism, and shifts in attention. It cannot remove uncertainty or replace position sizing, risk controls, and independent research.
The third is ignoring baselines. High activity is not always unusual activity. The question is whether a ticker's current behavior is materially different from its own recent history and its relevant peer group.
The fourth is trusting scores that cannot be explained. If a platform cannot show the source evidence, timestamps, and underlying drivers, users cannot determine whether the signal is fresh, credible, or duplicated. In fast markets, explainability is not a nice feature. It is part of the edge.
Turn Information Overload Into a Repeatable Process
Sentimentick is built around that operating principle: surface emerging ticker narratives through independently weighted social sentiment, verified news momentum, and technical analysis, then show the evidence behind the signal. The result is a research engine designed to reduce scanning time without asking users to surrender judgment.
The market will always produce more headlines, posts, charts, and opinions than one person can process. The advantage comes from knowing which changes deserve a closer look, why they are happening, and whether the market is beginning to validate them. Build your process around those moments, and your watchlist becomes a source of signal rather than another source of noise.