
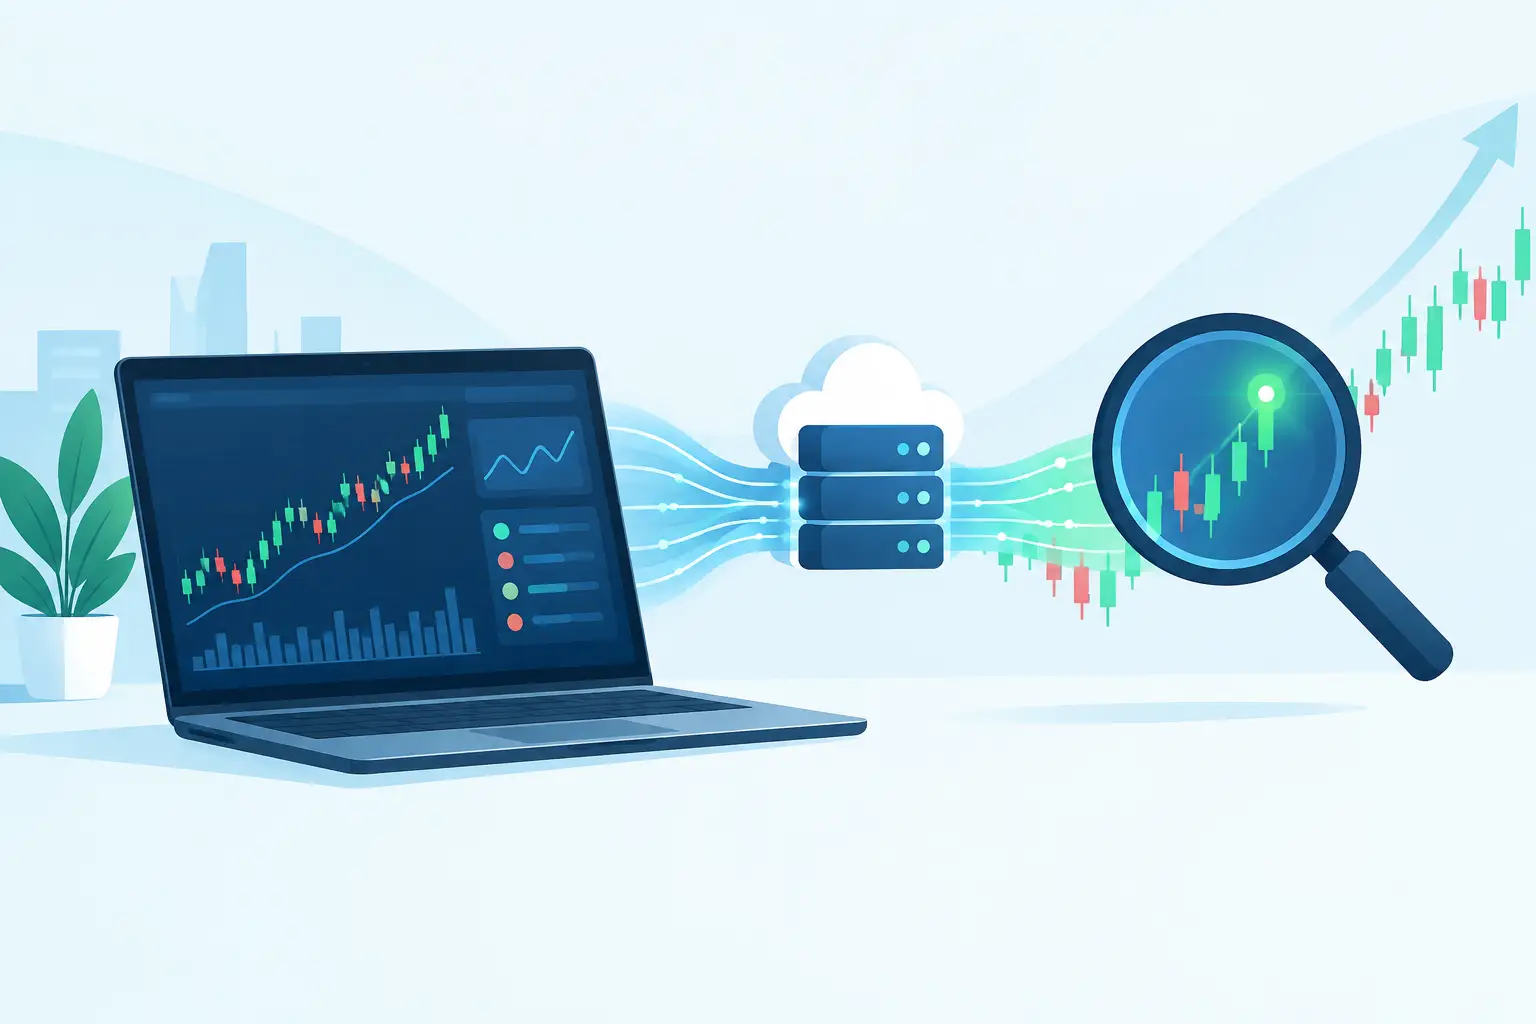
A price feed tells you where a stock has traded. A strong stock market data API helps explain why attention is building, whether the move has confirmation, and which tickers deserve research before the crowd arrives. That distinction matters when thousands of symbols, headlines, social posts, and technical setups are competing for attention at once.
For active traders, investors, and developers, market data is not a static reference layer. It is the input layer for faster decisions, custom screens, alerts, models, and conviction tracking. The quality of that input determines whether a dashboard surfaces a developing narrative or simply reports a move that has already happened.
What a Stock Market Data API Must Deliver
The baseline is obvious: historical and real-time price, volume, open, high, low, and close data. But a feed built only around candles leaves a major research gap. Price reflects market behavior. It does not always reveal the catalyst, the intensity of attention, or whether the underlying narrative is accelerating or fading.
A useful API should bring several data dimensions into a consistent ticker-level view: market activity, verified news, social discussion, sentiment scoring, and technical context. The goal is not to create more alerts. It is to make alerts more selective.
That requires clean symbol mapping, reliable timestamps, and enough metadata to understand what each observation means. If a headline arrives after a price spike, it should not be treated as an early catalyst. If a social post is repeated across accounts, it should not inflate attention. If an indicator uses delayed or adjusted data, your model needs to know that before it produces a signal.
Data timing is part of the product
“Real time” is often too vague for market workflows. Developers need to distinguish event time from ingestion time and delivery time. A news item may be published at 10:02:14, detected at 10:02:20, and reach an application at 10:02:24. Those seconds can matter when measuring the relationship between information and market response.
The same principle applies to trades, quotes, sentiment updates, and technical calculations. A dependable API documents update cadence and historical backfill behavior instead of leaving users to infer timing from inconsistent payloads.
Coverage needs to match the workflow
Broad market coverage sounds attractive, but relevance is more valuable than excess volume. A momentum scanner may need minute-level price and volume data alongside rapidly updating news and attention metrics. A longer-horizon analyst may prioritize daily technical history, narrative persistence, and changes in sentiment over several weeks.
The right coverage depends on what you are building. The API should let you retrieve the same core data consistently across individual tickers, watchlists, market screens, and historical periods.
Raw Data Alone Does Not Create an Edge
Many data stacks fail at the interpretation layer. They can return thousands of posts, articles, and bars, yet still force the user to decide what is material. That is not signal intelligence. It is information delivery.
The more useful approach is to score each data stream independently before combining them. News momentum should not be confused with social chatter. A technical breakout should not automatically validate a viral discussion thread. Each factor has a different failure mode, different speed, and different value depending on the market regime.
Consider a ticker with rising mention volume. That could indicate genuine discovery, a short-lived meme cycle, or repeated posts reacting to the same old headline. Now add verified news momentum. If credible coverage is increasing while technical participation improves, the narrative carries more weight. If price action remains weak and no fresh catalyst appears, the attention may be noise rather than a developing market event.
This is why evidence matters. Scores without source-level context make it difficult to judge whether an alert deserves action or dismissal. An API should preserve the underlying articles, posts, timestamps, labels, and measurements that support a score. Transparency lets developers tune their own filters and lets traders inspect the narrative behind a ranking.
Build Signals in Layers, Not in Isolation
The highest-value workflows combine independent layers without pretending they all mean the same thing. A practical model often starts with four questions:
- Is market activity changing relative to the ticker’s normal behavior?
- Is verified news creating a fresh or intensifying catalyst?
- Is social attention broadening, and is its sentiment direction clear?
- Does the technical picture confirm, contradict, or lag the narrative?
Those questions create a better framework than any single metric. High relative volume can identify participation, but it cannot establish cause. Positive sentiment can identify enthusiasm, but it can be distorted by repetition and low-quality sources. Technical indicators provide structure, but they are backward-looking calculations. The strongest research process tests whether these factors are converging.
For example, a developer could rank a watchlist by unusual attention, then require a threshold for verified news velocity and a separate threshold for technical strength. Another workflow may look for disagreement: heavy social conversation with weakening technical conditions, or a rising news cadence before broader online attention appears. Divergence is often as informative as confirmation.
Sentimentick is designed around this separation, weighting verified news, social discussion, and technical indicators independently so users can see what is driving a ticker’s score rather than relying on a black-box composite alone.
API Design Details That Change Research Quality
A market API can have compelling data and still become difficult to use if the integration details are weak. Schema clarity, rate limits, pagination, and error handling are not secondary concerns. They determine whether a scanner stays reliable during high-volume market periods.
Start with stable identifiers. Tickers can change, companies can merge, and different share classes can create ambiguity. Where possible, a well-designed system supports durable instrument identifiers alongside display symbols. Historical queries should account for symbol changes and corporate actions so that long-range analysis does not silently break.
Adjusted versus unadjusted price data also needs explicit treatment. Technical models, returns calculations, and backtests can produce materially different outputs depending on how splits and distributions are handled. There is no universal setting that fits every workflow, but the API should make the choice visible and consistent.
Then consider the shape of the response. A useful payload avoids forcing clients to make unnecessary follow-up calls. If a screener returns a ticker-level opportunity, the response should include the essential context: score components, timestamps, recent market behavior, and references to the evidence available for deeper inspection. That lowers latency and keeps the research flow intact.
For streaming use cases, incremental updates are usually better than repeated full refreshes. A client that receives only changed fields can react faster and use fewer requests. For historical analysis, predictable pagination and clear cursor behavior prevent missing records or duplicating data during large retrievals.
Match the API to the Decision Window
There is no single best configuration for every participant. A short-term scanner may favor fresh data, rapid alerting, and strict filters that reduce noise. A medium-term growth researcher may care more about persistent narrative improvement, earnings-related news velocity, and the durability of technical trends. A quantitative hobbyist may prioritize long historical coverage, normalized fields, and reproducible snapshots for model testing.
The common requirement is control. Users should be able to define watchlists, threshold logic, time windows, and output fields without rebuilding the data layer every time their process changes. Flexibility is especially important because market behavior changes. A filter that performs well during broad risk appetite may become far less useful when participation narrows or volatility rises.
Avoid treating API output as a final answer. Treat it as a disciplined way to allocate attention. The best systems help you move from a broad universe to a short, evidence-backed research queue quickly.
A Better Standard for Market Data
A stock market data API should not merely help an application display prices. It should help users detect changes in attention, evaluate the quality of the narrative, and place technical behavior in context. That means reliable timing, transparent evidence, independent signal layers, and integration details that hold up under real market pressure.
The next time a ticker appears on your screen, look beyond the latest candle. Ask what changed, who is validating the move, and whether the evidence is strengthening or fragmenting. That is where a data feed becomes a research advantage.