
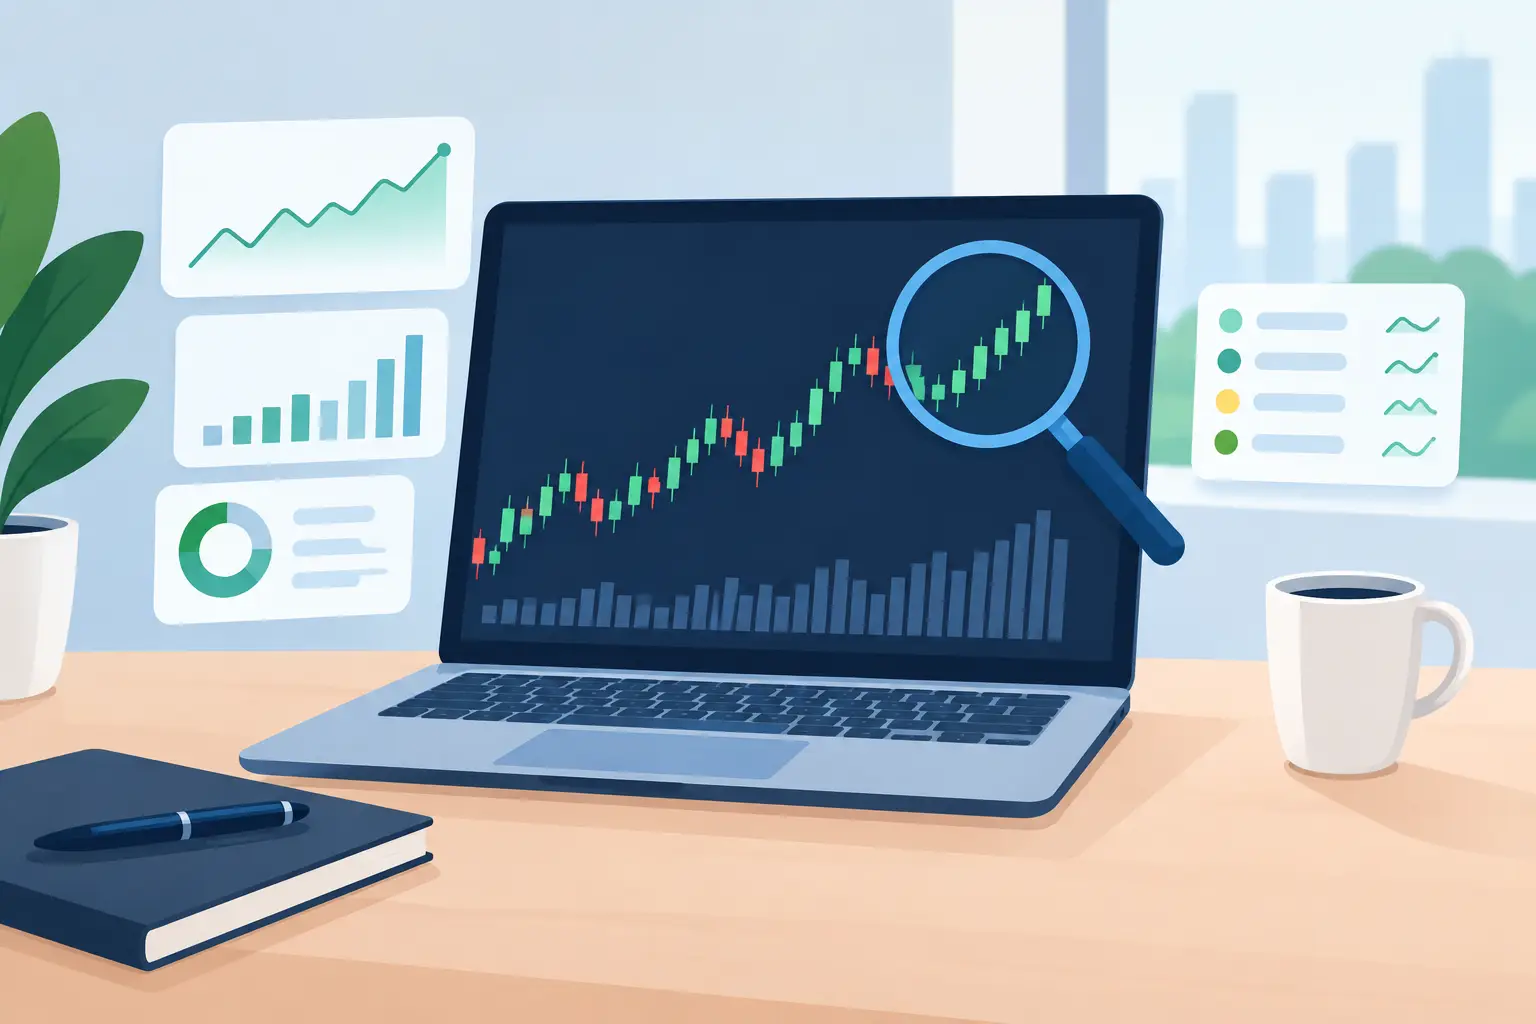
A ticker can look quiet on a price chart while its information environment is already changing. A cluster of verified headlines, accelerating discussion, unusual options interest, or a technical level under repeated pressure may show up before a large volume expansion. The right stock analysis tools help traders see that shift without spending hours jumping between feeds, charts, and browser tabs.
The goal is not to collect more data. It is to establish a faster process for identifying what has changed, why it matters, and whether market participation is beginning to confirm the narrative. For active traders and self-directed investors, that process is the edge.
What Stock Analysis Tools Should Actually Do
Most market platforms provide some version of charts, fundamentals, headlines, and watchlists. Those are useful starting points, but a serious research stack needs to do more than display information. It should help prioritize attention.
A useful platform answers four practical questions quickly: Which tickers are gaining attention? What is driving that attention? Is the source credible? Is price action confirming or rejecting the developing narrative?
That distinction matters because not all activity is signal. A ticker can trend heavily on social channels because of recycled speculation, a misleading headline, or a short-lived meme. It can also attract little public attention while a meaningful fundamental catalyst develops. The job of analysis software is to separate raw activity from evidence-backed momentum.
The difference between data and decision context
A price chart tells you what the market has done. A news feed tells you what happened. Sentiment data can show how participants are reacting. Technical indicators show whether the market structure supports that reaction.
Each view has a blind spot in isolation. Technicals can lag a catalyst. News can be widespread but already reflected in price. Social discussion can be early but unreliable. The strongest stock analysis tools keep these inputs distinct, then make the relationship between them easy to inspect.
That means showing the underlying evidence, not just presenting a single opaque score. If sentiment is rising, users should be able to see whether that rise comes from verified reporting, broad retail discussion, or a narrow group of repeated posts. Transparency makes a signal testable.
Build a Research Workflow Around Signal Confirmation
The most efficient workflow moves from broad discovery to narrow validation. It does not start with a favorite ticker and search for reasons to support an existing view. It starts with measurable change.
1. Screen for unusual attention
Dynamic screeners are the first filter. Look for tickers with an abnormal increase in news velocity, social mention volume, sentiment change, relative volume, price range expansion, or technical momentum. The specific settings depend on your time horizon, but the principle is consistent: focus on deviation from a ticker's normal behavior.
For a momentum trader, a sharp rise in verified news momentum paired with increasing attention may deserve immediate review. For a growth-oriented investor, sustained narrative strength across several sessions may be more relevant than a single spike. A good screener supports both approaches without forcing every user into the same preset.
The output should be a focused research queue, not a crowded list of every active symbol. If a screener returns hundreds of names, it has shifted the workload instead of reducing it.
2. Identify the catalyst and its quality
Once a ticker appears on the screen, inspect the trigger. Was there an earnings result, a regulatory development, a product milestone, an analyst revision, an industry event, or a macro factor affecting a group of stocks?
Then assess the quality of the information. Verified reporting generally carries more weight than anonymous claims or copied headlines. Timing matters as well. A story that is several days old may still be relevant, but it should not be treated like a new catalyst merely because discussion has resurfaced.
This is where evidence feeds become operationally valuable. Rather than accepting a narrative label, traders can trace the narrative back to its sources. That helps distinguish genuine information flow from circular amplification.
3. Measure whether sentiment is broadening or fading
Sentiment is most useful as a rate-of-change signal. A positive reading alone does not tell you much. What matters is whether the tone is improving, whether participation is expanding, and whether the discussion is connected to a defined catalyst.
Broadening participation can indicate that a story is moving from a small group into wider market awareness. But high mention counts without a verified driver can be a warning sign, especially when the language is repetitive or highly promotional. Sentiment should increase research priority, not replace research.
Independent weighting is essential here. News momentum, social sentiment, and technical strength should not be blended so aggressively that one noisy input masks weakness in another. A ticker with strong chatter but weak price confirmation is a different setup from one supported by credible news and improving technical structure.
4. Check price and volume in context
Technical analysis provides the market's response to the information. Look beyond a single green or red candle. Is the price holding above key moving averages? Is it consolidating after a move or becoming increasingly volatile? Is relative volume building? Are prior resistance or support areas influencing the current range?
Volume deserves context. A volume surge after a known event may confirm widespread participation. The same surge without a credible catalyst can be more difficult to interpret. Similarly, a price move on low volume is not automatically invalid, but it calls for more caution when measuring conviction.
The key is alignment. When news, sentiment, and technicals point in the same direction, the narrative is easier to monitor. When they conflict, the conflict itself is information. It may signal that the market has not reached consensus, that the story is unproven, or that attention has outpaced evidence.
Alerts Turn Research Into a Repeatable System
A watchlist is passive. Alerts make it active.
The best alerts are tied to conditions that would change your assessment of a ticker. That could be a jump in verified news activity, a sentiment reversal, an increase in social velocity, a volume threshold, or a price move through a defined technical level. Alerts should not simply notify you that something happened. They should tell you why the event is unusual.
For example, an alert based on rising mention volume alone may create noise. Pair it with a sentiment threshold or verified news trigger, and the alert becomes more selective. A technical alert can work the same way: a price-level event is more useful when it occurs alongside accelerating information momentum.
This is particularly valuable when monitoring a large universe of stocks. No trader can manually observe every developing narrative. Alert logic converts a fixed watchlist into a responsive monitoring system that surfaces changes as they emerge.
Choose Tools Based on Your Time Horizon
There is no single best configuration because the signal cadence changes by strategy.
Shorter-term traders often need real-time updates, intraday technical context, unusual activity detection, and fast evidence review. Their challenge is speed without sacrificing source quality. Medium-term participants may prioritize multi-day sentiment trends, earnings-related narrative changes, sector leadership, and sustained relative strength. Longer-horizon investors typically benefit from tracking whether the original thesis is gaining or losing support across news flow, market perception, and price structure over time.
Developers and quantitative researchers have another requirement: data access. A REST API can support custom dashboards, factor research, automated monitoring, and model inputs. But raw API access is only as useful as the methodology behind the fields. Look for clear definitions, reliable timestamps, historical consistency, and a way to understand how news and social inputs are categorized.
Common Mistakes That Create More Noise
The first mistake is treating every spike as an opportunity. Markets generate constant anomalies, and many disappear as quickly as they arrive. A signal earns attention when it has a catalyst, credible evidence, and some form of confirmation.
The second is relying on a single score. Composite scores are useful for ranking, but they should lead to investigation, not end it. Inspect the components. A high score driven by social activity has a different risk profile than one driven by verified news and technical momentum.
The third is using tools as a replacement for judgment. Platforms can compress research time and expose patterns that are difficult to see manually. They cannot eliminate uncertainty, predict every market reaction, or determine your risk parameters.
A Better Standard for Market Intelligence
Effective market intelligence is not about receiving more notifications. It is about seeing material change earlier and understanding the evidence behind it before attention becomes obvious.
Sentimentick is built around that standard: independently weighted news, social, and technical signals, supported by evidence feeds, custom alerts, dynamic screeners, and API-ready data. The practical advantage is a clearer research queue and less time spent sorting through disconnected market noise.
Set up your process around change, confirmation, and evidence. When a ticker starts to matter, your tools should make that clear before the market conversation gets crowded.