
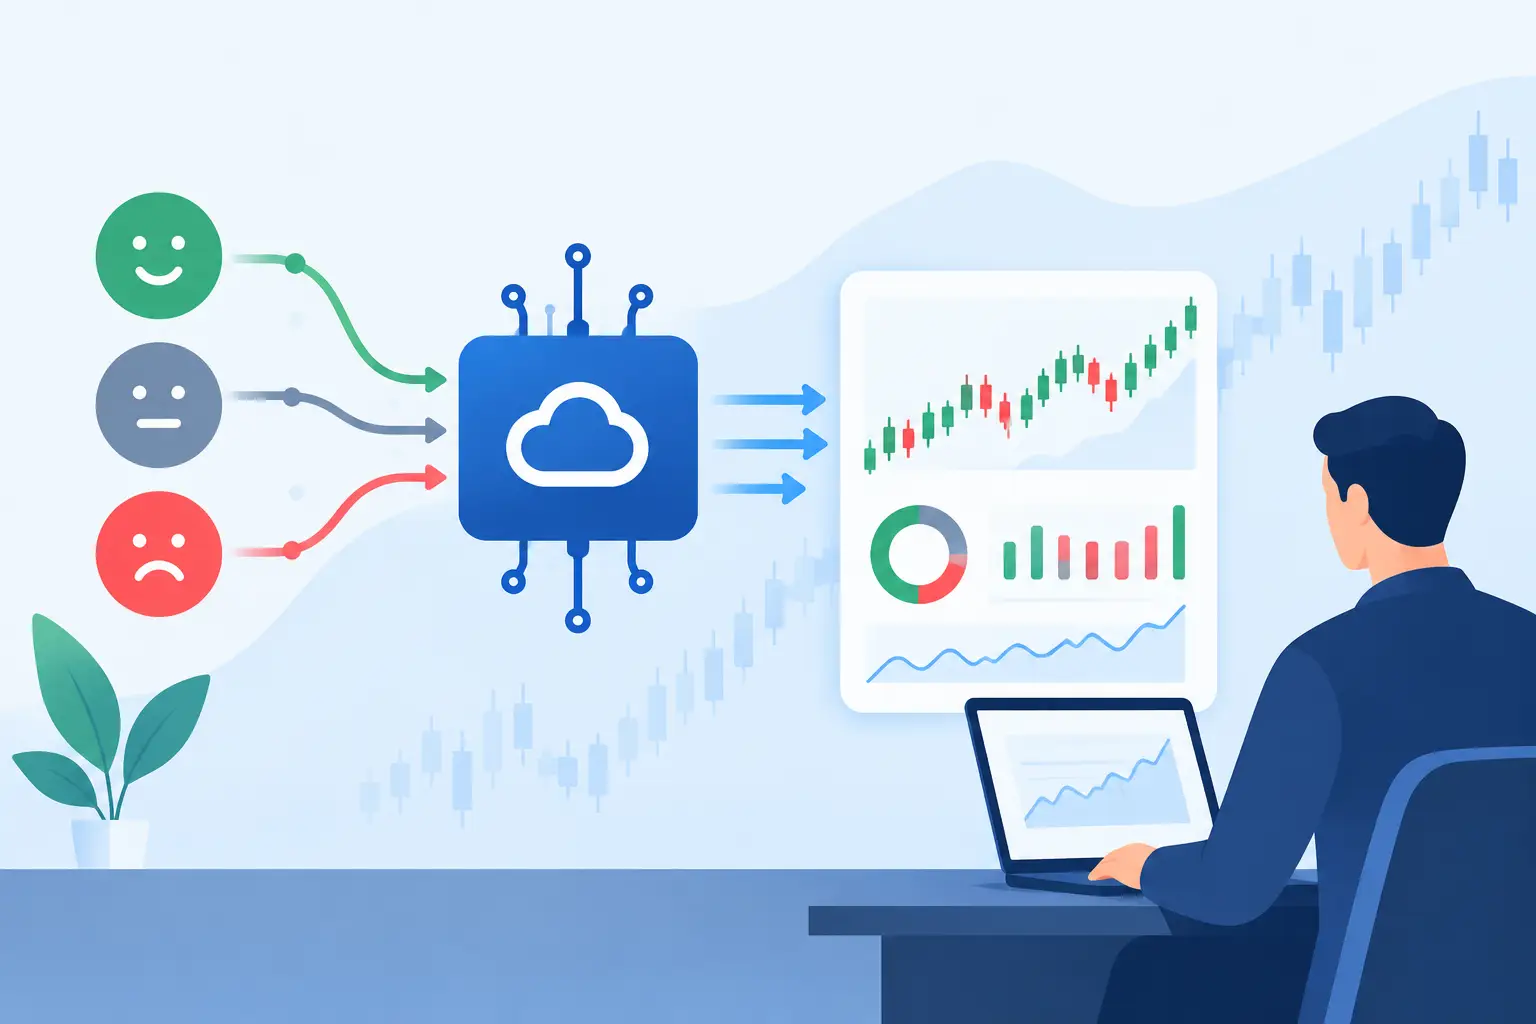
A headline hits at 8:17 a.m. Eastern. Within minutes, social discussion accelerates, related tickers begin appearing in scans, and the market narrative shifts. The challenge is not finding more information. It is turning that burst of attention into structured, testable signal before it becomes obvious in price and volume. A financial market sentiment API gives traders, investors, and developers a direct way to monitor that shift at scale.
For a serious workflow, sentiment is not a single score pulled from a noisy feed. It is a changing measure of attention, direction, credibility, and confirmation. The API matters because it makes those inputs available inside the tools where research and decisions already happen.
What a Financial Market Sentiment API Should Deliver
At its simplest, a sentiment API returns a directional reading tied to a ticker, sector, or broader market topic. That is useful, but it is rarely enough. A score without source context can create false confidence, especially when discussion volume is low or driven by recycled posts.
A stronger financial market sentiment API delivers several layers of intelligence: sentiment direction, activity volume, the rate of change in attention, source type, timestamp, and the evidence behind the reading. The goal is to see whether a narrative is gaining traction, not merely whether the latest set of mentions sounds positive or negative.
For example, a ticker with moderately positive sentiment and rapidly rising verified-news coverage may deserve more research than one with extremely positive social sentiment from a small cluster of accounts. The first signals a potentially broader information event. The second may be noise, speculation, or a short-lived conversation.
This distinction is where data design becomes market edge. Raw mention counts are easy to collect. Normalized, source-aware, ticker-level signals are harder to build and far more useful.
Why Source Separation Changes the Signal
Markets react differently to a regulatory filing, an earnings-related report, a high-quality publication, a viral social post, or a surge in options-related conversation. Combining every source into one opaque score removes that distinction right when it matters most.
A practical API should let users evaluate verified news momentum, social sentiment, and technical context independently. Each layer answers a different question. News helps identify what changed. Social data helps measure whether attention is spreading. Technical data shows whether the market is confirming, rejecting, or ignoring the narrative.
That separation also gives developers control over weighting. A momentum-focused system may place more emphasis on acceleration in ticker discussion and relative volume. A longer-horizon research model may prioritize verified news and changes in narrative persistence over intraday chatter. There is no universal weighting model because the right inputs depend on time horizon, liquidity, and strategy design.
Transparent evidence feeds matter here. If a sentiment spike cannot be traced to the underlying headlines, posts, or timestamps, it is difficult to validate and even harder to improve a model around it. Signal intelligence needs an audit trail.
Build Around Change, Not Static Sentiment
Static sentiment is often late. By the time a ticker has an overwhelmingly positive or negative reading, the market may already have absorbed the obvious story. The more actionable question is whether sentiment is changing unusually fast relative to its own baseline.
Developers can model this with a few core measures. Track the current sentiment score, then compare it with recent rolling windows. Measure mention velocity rather than only total mentions. Calculate an attention z-score against the ticker's normal activity. Finally, flag divergence between social activity, news momentum, and technical confirmation.
A basic workflow might detect a sharp rise in verified-news momentum, then check whether social discussion is expanding across independent sources. If both are rising while the technical picture is still neutral, the system can place the ticker on a watchlist or send an alert for review. If social activity rises without credible news support and the pattern fails to confirm, the event can be classified as lower conviction.
The value is not automatic prediction. It is faster prioritization. Instead of manually scanning thousands of symbols, research time moves toward the names where the information environment is changing most materially.
API Workflows That Fit Real Trading Research
The most effective use cases begin with a clear research question, not an endpoint. A financial market sentiment API becomes more valuable when it is embedded in a repeatable workflow.
Ticker-Level Narrative Monitoring
Monitor a focused universe of holdings, sector leaders, and high-beta names for unusual changes in news and social attention. The key is to alert on deviations from normal behavior rather than every new mention. A low-volume ticker may look active after a handful of posts, while a heavily followed large-cap stock may require a much larger jump to register as meaningful.
Pre-Market and Intraday Scanning
A scanner can rank symbols by attention velocity, sentiment change, verified-news intensity, or a composite score. Used before the opening bell, it helps narrow the research field. Used intraday, it can surface emerging narratives that are not yet visible in conventional volume-based screens.
The screen should remain adjustable. A broad market-risk day calls for different filters than a sector-specific news cycle. Fixed thresholds are convenient, but adaptive baselines are generally more reliable.
Event Classification
Sentiment data can help distinguish between a one-off burst and an evolving narrative. Developers can label events by source composition, duration, acceleration, and price response. Over time, those labels create a research dataset for testing which combinations have historically led to sustained attention and which tended to fade.
Custom Dashboards and Models
For quant-minded users, REST API data can feed proprietary dashboards, notebooks, databases, or alert engines. Some teams will prefer a simple rules-based framework. Others will combine sentiment variables with factor data, technical indicators, and event features in a systematic model. The API should support both without forcing users into a black-box interpretation.
Data Quality Is the Real Differentiator
Sentiment data is vulnerable to spam, duplicated coverage, bot activity, sarcasm, ticker ambiguity, and bursts of low-value reposting. A system that counts everything equally may produce impressive activity charts and weak research output.
Quality control starts with entity resolution. The platform must correctly associate a company with its ticker while avoiding unrelated uses of the same symbol or name. It also needs deduplication so syndicated articles and reposted content do not inflate momentum artificially.
Source weighting is equally important. Verified reporting and original social commentary should not be treated as identical inputs. Neither should a high-following account and a sudden network of low-credibility profiles. Filtering does not mean ignoring social data. It means preserving its speed while reducing its susceptibility to manipulation.
Latency is the final operational test. A signal that arrives after the market has fully reacted may still be useful for historical analysis, but it loses value for real-time monitoring. Check timestamps, refresh frequency, historical coverage, and whether the API delivers a current reading or merely periodic snapshots.
How to Evaluate an API Before Building on It
Start with the data schema. Confirm that responses include ticker identifiers, timestamps, source categories, sentiment values, attention or volume measures, and enough metadata to trace the signal back to evidence. A single composite number may be convenient for a dashboard, but it is restrictive for model development.
Then test coverage against the names and conditions that matter to your workflow. Large, widely discussed equities are the easy case. Examine smaller names, sector-specific news cycles, and periods of abnormal market activity. Coverage gaps will show up quickly when you compare the feed with your actual research universe.
Finally, test consistency. Pull historical data across multiple periods and look for stable definitions. If the calculation method changes without clear versioning, backtests become difficult to interpret. Documentation, rate limits, error handling, and predictable field behavior are not glamorous features, but they determine whether an API can support a production workflow.
Sentimentick approaches this problem by separating social activity, verified news momentum, and technical context while preserving the evidence behind each signal. That structure gives users room to build their own conviction framework instead of relying on a score they cannot interrogate.
Turn Attention Into a Research Advantage
The market does not reward information volume. It rewards the ability to recognize which information is changing the narrative, how quickly that change is spreading, and whether the tape is beginning to validate it. A well-designed sentiment API brings those questions into one programmable research layer.
Start small: monitor a defined ticker universe, establish normal attention baselines, and review the evidence behind every major alert. Once the signals prove useful in context, expand them into screeners, dashboards, and custom models. The edge comes from disciplined interpretation, not from treating sentiment as a shortcut.