
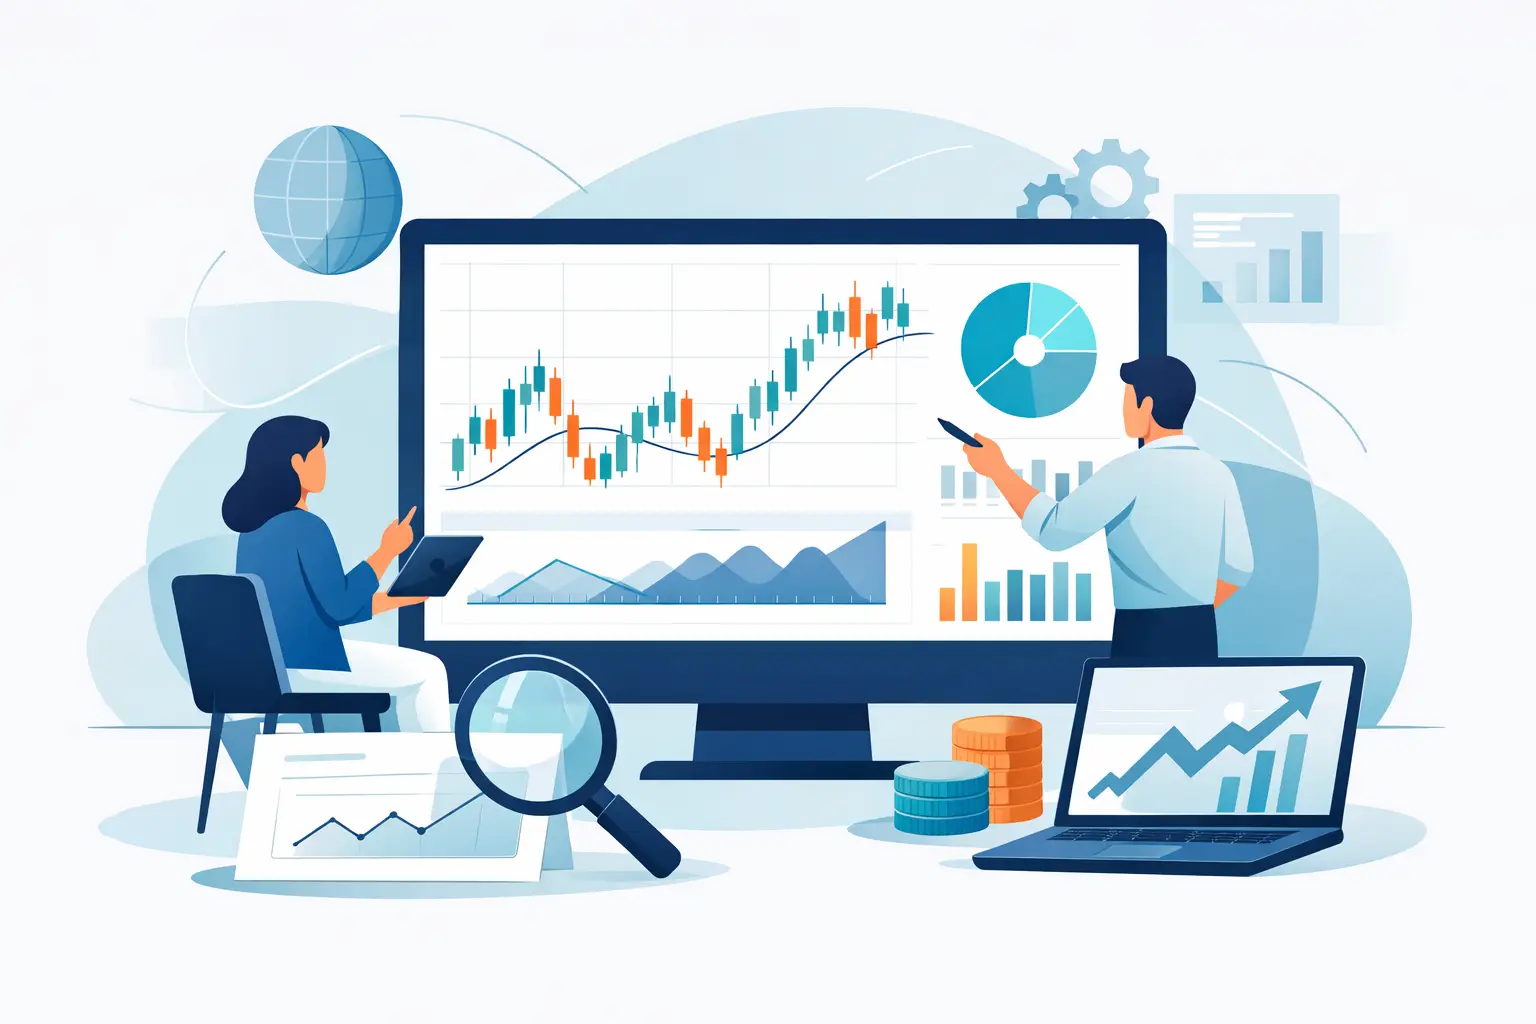
A ticker can become the center of the market’s attention long before a standard chart scan makes it obvious. A stock analysis platform earns its place by detecting that shift early, showing what is driving it, and helping traders assess whether the evidence supports sustained attention or a short-lived burst of noise.
The challenge is not access to market data. It is deciding what deserves attention while news, social posts, filings, price action, and sector activity are all moving at once. Traders who can organize those inputs around a clear ticker-level narrative spend less time chasing headlines and more time studying the conditions that may matter.
A Stock Analysis Platform Is a Decision System
Most market tools provide a slice of the picture. Charts show price history. News feeds show events. Social feeds show conversation. Screeners show metrics. Each is useful, but each can also produce false confidence when viewed alone.
A capable stock analysis platform brings these inputs into one research workflow. Its job is not to declare certainty or replace judgment. Its job is to reduce the distance between an emerging signal and the evidence needed to investigate it.
That distinction matters when a ticker starts moving before its reason is widely understood. A sharp increase in discussion may signal genuine attention, but it can also be recycled speculation. A news item may be material, but its market impact depends on timing, expectations, and whether price has already reacted. Technical strength may confirm demand, or it may simply reflect a brief liquidity event.
The platform should make those differences visible. It should show the signal, the supporting evidence, the timing, and the market context without forcing users to assemble the story across a dozen disconnected tabs.
The Three Inputs That Create Useful Signal Intelligence
Early detection works best when independent data types are evaluated separately before they are combined. When every input is blended into a single opaque score, traders lose the ability to understand what is actually changing.
Verified news momentum
News is often the first durable source of a market narrative. But a feed filled with duplicate coverage, low-value commentary, and delayed syndication does not create an edge. What matters is verified news momentum: whether credible new information is appearing, how quickly coverage is accelerating, and whether the subject is materially relevant to the company or its sector.
A useful system identifies the underlying event, surfaces the source evidence, and distinguishes a new development from the tenth article repeating the same fact. This lets a trader evaluate the catalyst instead of reacting to headline volume alone.
Social sentiment and attention quality
Social chatter can spot changes in attention before they appear in traditional media. It is also where noise is most concentrated. A sudden burst of posts may reflect real research spreading through the market, coordinated promotion, a viral joke, or a reaction to price that has already moved.
The answer is not to ignore social data. It is to measure it with discipline. Look for changes in conversation velocity, sentiment direction, unique participation, and persistence over time. Then inspect the underlying posts and themes. High message volume without a credible narrative deserves skepticism. Conversation that aligns with verified news and improving market structure deserves closer review.
Technical context
Technical analysis gives the narrative a market-based frame. Price trend, relative strength, volume behavior, volatility, support and resistance, and moving-average structure reveal how participants are responding in real time.
Technical data should not be treated as a standalone prophecy. Its value increases when it answers a specific question: Is attention translating into measurable demand? Is the ticker acting differently from its recent behavior or its sector? Is volatility expanding as interest rises? Context turns a raw indicator into a research input.
Why Transparent Evidence Beats Black-Box Scores
A single score is fast, but it is not enough for serious market research. Scores can help prioritize a watchlist, especially when thousands of tickers compete for attention. They become dangerous when users cannot see the ingredients behind them.
Transparent evidence feeds solve that problem. If sentiment is rising, users should be able to see the posts, themes, and timing behind the move. If news momentum is accelerating, they should see which verified events are contributing. If a technical condition is triggered, they should understand the price and volume behavior that produced it.
This is where research speed and discipline can coexist. The platform performs the aggregation, while the trader retains control over interpretation. A signal becomes more useful when it can be challenged quickly.
For example, a ticker may show a surge in positive discussion. The evidence feed may reveal that most of that activity came after a large intraday move, with no new verified catalyst. That does not make the signal useless, but it changes its meaning. It may represent reactive attention rather than early narrative formation.
Conversely, a modest rise in discussion paired with newly verified company news and improving relative strength can be more meaningful than an extreme sentiment spike. The highest-quality signals are often aligned across inputs, not merely loud on one channel.
Build Workflows Around Change, Not Static Screens
Static screening is useful for defining a universe. Dynamic screening is better for finding what has changed. Active traders do not need another long list of familiar names. They need a way to identify outliers as conditions develop.
A practical workflow starts with a focused universe: liquid names, a sector group, earnings-related candidates, or a personal watchlist. From there, monitor for meaningful deviations such as accelerating news coverage, unusual shifts in social attention, sentiment reversals, relative strength changes, and abnormal volume behavior.
The next step is confirmation. Review the evidence, compare the ticker with its peers, and check whether the activity is persistent across multiple timeframes. A move that looks significant in isolation may be ordinary during a broad sector rotation or high-volatility session.
Finally, document the narrative. What changed? When did it start? Which source provided the catalyst? What technical behavior confirmed or contradicted the premise? This creates a repeatable research record instead of a stream of disconnected observations.
Custom alerts make this workflow operational. The best alerts are not generic price notifications. They reflect combinations of conditions that matter to a specific process: a sentiment acceleration alongside fresh verified news, a watchlist name gaining unusual attention, or a technical shift occurring while the broader narrative strengthens.
Different Users Need Different Levels of Access
A visual dashboard is the fastest path for traders who need to scan, investigate, and monitor without building infrastructure. It should prioritize clarity: which tickers are changing, why they are changing, and what evidence supports the shift.
Developers and systematic investors need a different interface. They may want raw or structured signals delivered through an API so they can integrate sentiment, news momentum, and technical conditions into proprietary models, internal dashboards, or automated monitoring systems.
Neither approach is inherently better. It depends on the workflow. A discretionary momentum trader may value a fast visual evidence trail. A quantitative hobbyist may value configurable data access and consistent fields. The right platform supports both without turning useful market intelligence into a maze of settings.
Sentimentick is built around this split: a visual research environment for rapid ticker investigation and developer-ready API access for users building their own analytical workflows.
What to Look for Before You Rely on a Platform
Evaluate the platform by the quality of its signal process, not by the number of widgets on the screen. It should distinguish verified sources from internet noise, preserve evidence behind its signals, and show how sentiment, news, and technical indicators contribute independently.
Speed also matters, but speed without context can create more mistakes, not fewer. A fast alert is only useful if it arrives with enough information to evaluate relevance. Look for tools that help filter a large market universe into a manageable set of research priorities.
Pay attention to flexibility as well. Market conditions change, and so should the way you monitor them. A platform that supports custom watchlists, dynamic screeners, configurable alerts, and data access gives users room to refine their process rather than forcing every strategy into the same template.
The real advantage is not seeing more data than everyone else. It is recognizing when attention is shifting, validating the reason with transparent evidence, and maintaining a repeatable process when the market gets noisy. Build your workflow around that standard, and the next developing narrative becomes easier to investigate before it becomes obvious.