
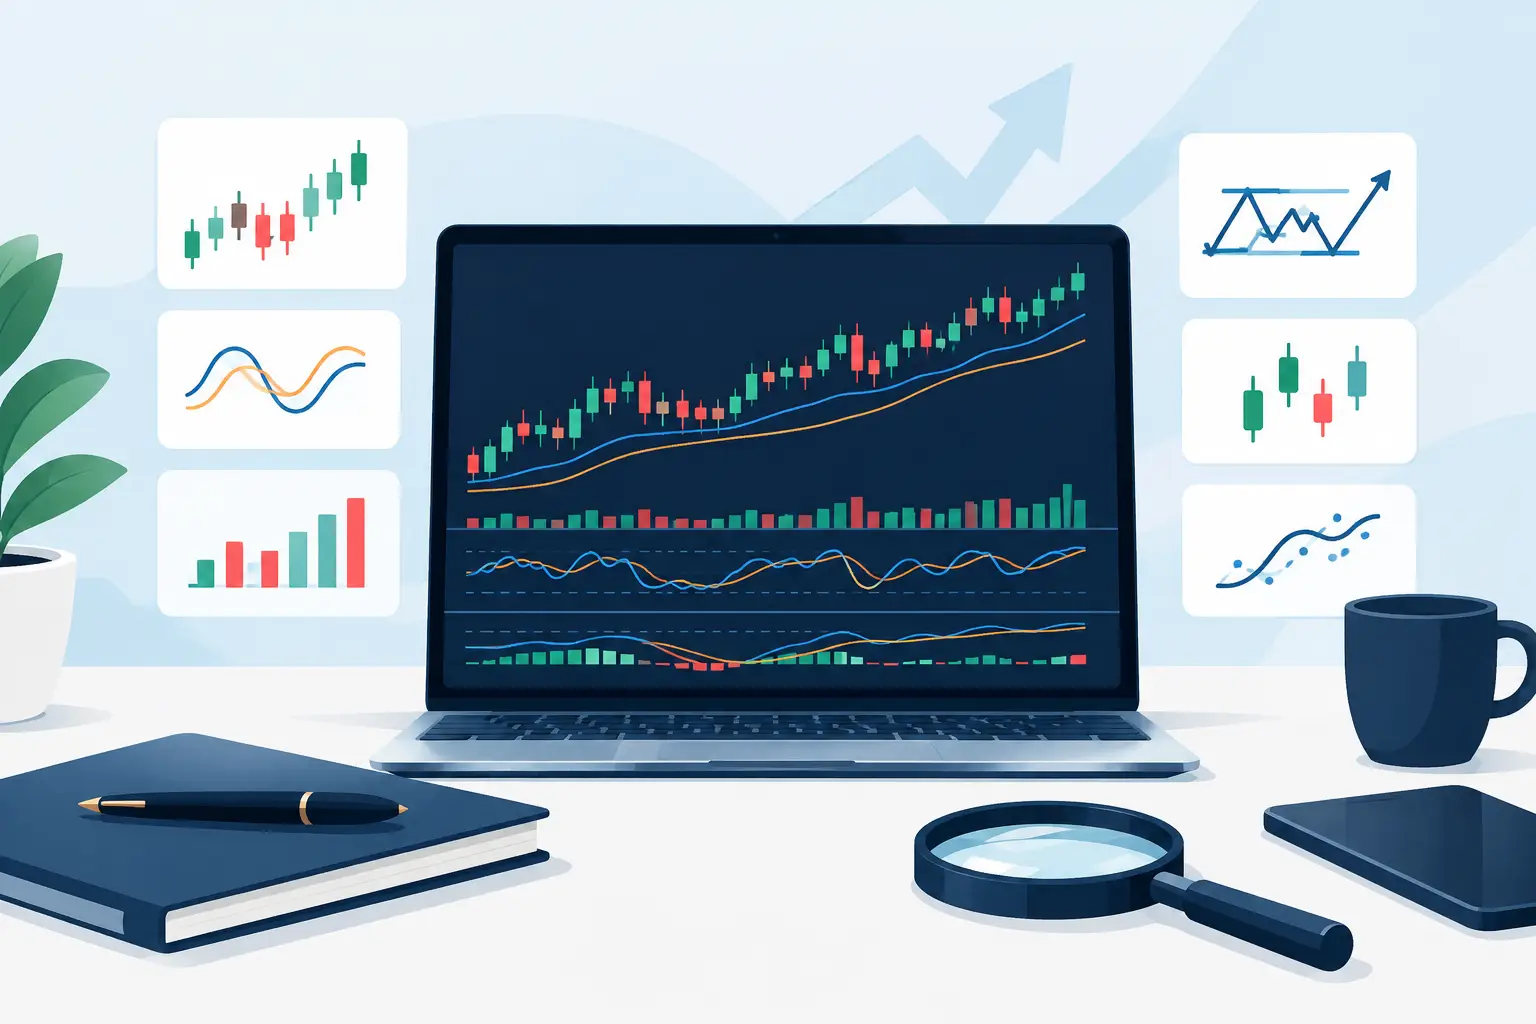
A chart can show where price has been. It cannot explain, by itself, why attention is accelerating into a ticker or whether a move has real narrative support. The most effective technical analysis tools for stock market research turn raw price action into a decision-ready context: trend, momentum, participation, volatility, and key levels. The edge comes from reading those inputs together, not collecting more indicators.
For active US market participants, the practical goal is simple: identify the market state, detect shifts early, and separate a meaningful setup from a chart that merely looks active. That requires a focused toolkit and a disciplined workflow.
Technical Analysis Tools for Stock Market Research
Technical analysis is often reduced to indicator overlays. That is too narrow. A charting framework works when each tool answers a different question and the answers do not conflict without explanation.
Trend tools establish direction. Momentum tools measure the rate of change. Volume tools show participation. Volatility tools define the normal range of movement. Support and resistance map the levels where market memory is likely to matter. Together, they create a working model of the ticker rather than a collection of disconnected signals.
The critical distinction is between confirmation and prediction. Technical tools do not forecast the future with certainty. They reveal probabilities, structure, and changes in behavior. A strong process treats every signal as evidence with a confidence level, not a command.
Moving averages: define trend and structure
Moving averages remain useful because they simplify noisy price data. A short-term average responds quickly to recent action, while a longer-term average provides a broader view of trend direction. The distance between price and an average, the slope of the average, and repeated reactions around it can all provide context.
A rising long-term average with price holding above it suggests a different market structure than a flat average with frequent reversals through it. Neither condition is automatically favorable or unfavorable. The point is to understand whether the ticker is trending, consolidating, or losing directional control.
Moving averages work best as a structure tool, not as an isolated trigger. In a choppy market, frequent crossings can generate noise. In a persistent trend, they can help keep attention on the prevailing direction instead of every intraday fluctuation.
Relative strength: measure leadership
Relative strength compares a stock's performance against a benchmark, sector, or peer group. This is one of the most useful filters for finding where capital is concentrating. A stock may be rising in absolute terms while underperforming its sector. That distinction matters when market leadership is narrow.
Use relative strength to ask whether a ticker is attracting attention ahead of its group, moving with the group, or lagging while the group advances. It is especially valuable for swing and momentum research because leadership often persists longer than a single price burst.
Relative strength is context-dependent. A strong ratio during a broad risk-on move carries a different meaning than relative resilience during a market pullback. The latter can reveal durable demand that a simple price chart may not make obvious.
Momentum oscillators: detect acceleration and exhaustion
Tools such as the Relative Strength Index, stochastic oscillator, and MACD help quantify momentum. They can show when price acceleration is strengthening, slowing, or diverging from the underlying trend.
The common mistake is treating any extreme oscillator reading as a reversal signal. In strong trends, momentum can remain elevated or depressed for longer than expected. An extreme reading is better interpreted as a condition requiring context: Is volume expanding? Is the move supported by verified news? Is price breaking from a multi-week range, or extending far beyond normal volatility?
Divergences can be informative, but they deserve skepticism. A momentum indicator weakening while price advances may signal fading participation, or it may simply reflect a pause before continuation. Confirmation from price structure and volume is what turns a divergence into a useful research signal.
Volume and VWAP: identify participation
Price tells you what happened. Volume helps show how broadly the move was accepted. Above-average volume on a breakout from a well-defined range can indicate meaningful participation. A similar move on thin volume may be less reliable, particularly in smaller or less liquid names.
Volume should be measured against the ticker's own recent history, not just a static threshold. Ten million shares may be ordinary for one stock and exceptional for another. Relative volume gives the cleaner read: how active is this ticker compared with its typical activity at this time?
Volume-weighted average price, or VWAP, adds an intraday reference point. It shows the average price paid, weighted by volume, and can help frame whether intraday participants are generally positioned above or below current price. For active traders, VWAP is most useful when combined with opening range behavior, volume expansion, and a clear catalyst.
Volatility tools: calibrate expectations
Volatility is not just risk. It is a measurement of opportunity, noise, and position management complexity. Average True Range, Bollinger Bands, and historical volatility can show whether a stock is moving within its usual range or entering an expanded state.
A narrow volatility range can precede an expansion, but it does not reveal direction. A wide range can reflect a major news event, a crowded narrative, or unstable liquidity. The right interpretation depends on the catalyst and the quality of participation.
Use volatility metrics to avoid applying the same expectations to every ticker. A one-dollar move means little without knowing the stock's normal daily range. Volatility-aware analysis creates more realistic thresholds for judging whether a move is routine, notable, or structurally significant.
Build a Signal Stack, Not an Indicator Pile
The strongest technical workflows combine a small number of non-overlapping inputs. Adding five momentum oscillators rarely improves signal quality because they are often measuring the same underlying behavior. It increases the chance of finding confirmation for an existing bias.
A cleaner signal stack has four layers:
- Market regime: Determine whether the broader market and relevant sector are trending, rotating, or volatile.
- Ticker structure: Map trend, support, resistance, moving averages, and range boundaries.
- Participation: Review relative volume, VWAP behavior, and relative strength versus peers.
- Catalyst context: Check verified news momentum and sentiment shifts to understand what may be driving attention.
This framework answers a more useful question than, “What does the indicator say?” It asks whether price structure, participation, and narrative are aligned. When they are not aligned, the mismatch is often the signal worth investigating.
For example, a technical breakout with muted participation and no verified catalyst may require lower confidence than a similar chart pattern accompanied by accelerating news coverage and a measurable rise in market attention. Conversely, viral chatter without price confirmation can be noise. The chart and the narrative should challenge each other.
A Faster Workflow for Active Market Monitoring
Research speed matters when hundreds or thousands of tickers compete for attention. Start with a screener that identifies outliers in relative volume, price change, volatility, or technical structure. Then narrow the list by sector strength and catalyst quality.
At the ticker level, review the daily chart first. It provides the structure that intraday action can obscure. Mark key range boundaries, prior reaction areas, trend direction, and volume behavior. Next, move to the intraday chart only if the name has current attention and sufficient liquidity for your process.
This is where unified signal intelligence has a practical advantage. Sentimentick brings technical indicators, verified news momentum, and social attention into the same research view, making it easier to determine whether a chart move is being reinforced by a developing narrative or inflated by temporary noise.
Set alerts around conditions, not just price. An alert becomes more valuable when it detects a combination such as a range break, unusual volume, and rising news momentum. Condition-based monitoring reduces screen time while keeping focus on the moves that are changing character.
What Technical Tools Cannot Solve
No technical setup removes event risk, liquidity risk, or the impact of a sudden shift in market regime. Indicators also lag by design because they are derived from prior price and volume data. Their value is not clairvoyance. Their value is consistency.
False breakouts, failed continuations, and sharp reversals are part of market behavior. The response is not to search for a perfect indicator. It is to define invalidation levels, manage exposure according to volatility, and avoid treating a single chart event as proof of a durable trend.
Technical analysis becomes more reliable when it is paired with evidence. Watch where price is moving, how strongly participation is building, and whether verified information supports the move. That is how a chart stops being a picture of the past and becomes a sharper tool for monitoring what the market is pricing next.