
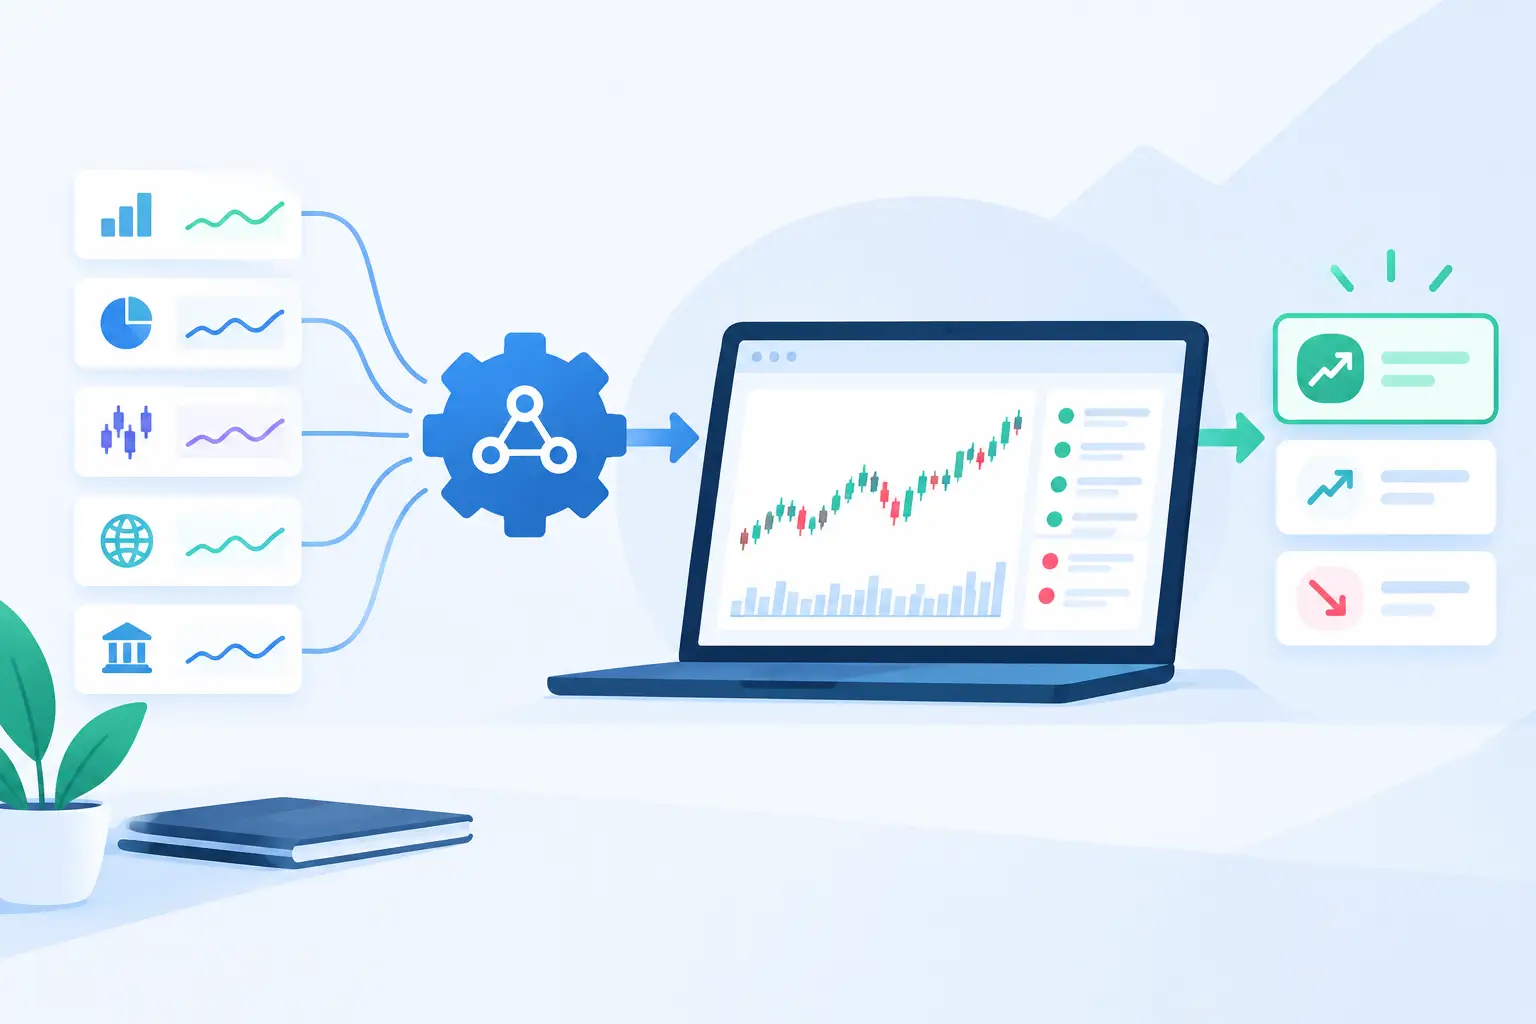
A stock screener API changes the job from checking a watchlist to continuously querying the market for specific conditions. Instead of opening charts, scanning headlines, and sorting thousands of symbols by hand, traders and developers can define what matters, retrieve matching tickers, and evaluate the evidence behind each signal.
That distinction matters when a narrative starts forming before the broad market recognizes it. A price move can be late. Raw social volume can be noisy. A useful screener API combines market context with information that explains why attention is building, then makes that data available for dashboards, alerts, research pipelines, and custom models.
What a Stock Screener API Should Actually Do
At a basic level, a screener filters a security universe. You might request US-listed equities above a defined market capitalization, symbols trading above a moving average, or names with unusual relative volume. Those are useful starting points, but they are not enough for an active workflow.
A capable stock screener API should let you screen across multiple signal layers at once: price and volume behavior, technical state, news activity, sentiment direction, social attention, and fundamental attributes. The output should be structured enough to sort, rank, filter, and store without scraping a visual interface.
The real value is not simply receiving a list of tickers. It is receiving a ranked set of candidates with context. If a symbol appears because discussion is accelerating, verified news coverage is expanding, and technical momentum is improving, your system should expose those components separately. That allows you to judge whether the signal reflects broad confirmation or a single noisy input.
For a trader, this reduces research latency. For a developer, it creates a reusable signal layer that can power internal tools, notifications, scans, and historical analysis. For an independent analyst, it replaces fragmented tabs with a queryable research process.
The Difference Between Filters and Signal Intelligence
Traditional filters answer static questions: Which stocks closed above a certain price? Which symbols had more than a set amount of volume? Which companies fall within an industry group?
Signal intelligence answers a more time-sensitive question: Which tickers are experiencing a meaningful change in attention or market behavior right now?
That requires time-series data and clear definitions. A rise in social mentions is not automatically informative. It may come from repeated posts, low-quality accounts, or an already crowded discussion. Likewise, a surge in headlines may reflect syndicated coverage instead of a new catalyst.
A higher-quality API distinguishes sources and shows the components behind a score. Consider a screen designed to identify emerging interest. It could combine increasing verified-news momentum, improving social sentiment, a rising attention rate, and a technical confirmation condition. Each input should remain inspectable. Black-box ranks may be convenient, but transparent evidence is more useful when conviction depends on understanding what changed.
This is where Sentimentick is designed to operate: verified news, social discussion, and technical indicators are independently weighted rather than blended into an unexplained number. That gives users room to build a process around the signal instead of treating every spike in attention as equivalent.
Core Data Fields to Look For
The best fields depend on your strategy and holding period, but the API should cover both selection and validation. Selection fields help identify candidates. Validation fields help explain why they appeared.
For market context, look for last price, percentage change, relative volume, intraday range, liquidity measures, market capitalization, sector, and exchange. These fields keep screens practical. A signal that appears in an illiquid symbol may require different handling than the same signal in a highly traded large-cap name.
Technical fields should go beyond a single indicator. Moving-average position, trend direction, momentum readings, volatility measures, support or resistance proximity, and recent range behavior can provide the context needed to separate a narrative from a confirmed move. The point is not to stack indicators until a screen looks sophisticated. The point is to describe market structure in a repeatable way.
Sentiment and attention fields need even more care. Useful measures include sentiment score, sentiment change over a selected period, mention count, mention velocity, news count, news velocity, source quality, and timestamped evidence. An absolute count can be misleading. A small company moving from five credible mentions to thirty may be showing a more meaningful shift than a heavily followed ticker moving from 5,000 mentions to 5,100.
Build Queries Around Change, Not Just Thresholds
Threshold-only screens are easy to write, but they often return the same familiar names. A better approach is to query for acceleration.
For example, instead of screening only for high social activity, screen for a meaningful increase in social activity versus its recent baseline. Instead of asking for positive news sentiment, request symbols where news sentiment has improved over the past day or week and the number of verified articles is rising. Instead of looking only for elevated volume, combine relative-volume expansion with a technical condition that places the move in context.
This is the difference between monitoring popularity and detecting a shift. Popularity is often visible already. The edge comes from identifying when attention, information flow, and technical behavior begin to align.
Time windows are central to this design. A five-minute alerting workflow needs different thresholds from a swing-trading research workflow, and both differ from a multi-week thematic screen. Your API queries should make the lookback window explicit. If a sentiment score is calculated over 24 hours, that should not be casually compared with a one-hour momentum signal without understanding the mismatch.
Design for Evidence, Not Just Alerts
An alert without supporting context creates another stream of noise. When a screen triggers, your workflow should capture the reason: the fields that crossed a threshold, the prior values, the time of the change, and the underlying news or discussion evidence where available.
This makes post-signal review possible. You can inspect whether a pattern consistently appears before sustained momentum, whether it is concentrated in a particular sector, or whether it produces too many false positives during high-volatility sessions. It also keeps discretion grounded in data instead of memory.
A practical implementation stores each screen result as a snapshot. Record the ticker, query version, timestamp, rank, factor values, and evidence identifiers. Over time, this becomes a dataset for improving your conditions. You may find that news velocity matters more when paired with positive sentiment change, or that social acceleration only deserves attention after liquidity filters are applied.
The API should support pagination, stable identifiers, predictable timestamps, and clear update behavior. These details sound operational, but they determine whether your records can be trusted. A fast signal is less useful if the system cannot tell you when it was calculated or whether a response contains delayed data.
Technical Considerations for Developers
A developer-ready screener is not just an endpoint that returns JSON. It needs a predictable schema, documented field meanings, sensible rate limits, error handling, and enough flexibility to avoid creating a separate endpoint for every screen idea.
Start by deciding whether screening happens server-side, client-side, or through a hybrid model. Server-side filtering reduces bandwidth and makes alerting easier. Client-side filtering is useful when you need to experiment with proprietary calculations after receiving a wider universe. A hybrid approach often works best: request a focused population from the API, then apply model-specific ranking locally.
Caching also matters. Some fields change every market tick, while others, such as sector classification or market capitalization, can be refreshed less often. Treating all data as equally time-sensitive wastes requests and can create avoidable latency. Separate reference data from streaming or frequently refreshed signals.
Rate limits should shape the architecture from the beginning. Polling every symbol individually is rarely efficient. Prefer broad screen requests, incremental updates, batch retrieval, and event-driven alerts when available. If an API returns a ranked universe, persist the response and calculate differences between snapshots rather than rebuilding the entire state on every cycle.
Finally, test the behavior around market open, major news events, and data gaps. Those are the moments when screening systems face the most demand and the highest probability of noisy inputs. A disciplined fallback plan, including timestamps and stale-data checks, prevents a delayed response from being treated as a current signal.
A Practical Workflow for Active Research
Start with one narrow use case rather than building an all-purpose scan. You might monitor liquid US equities for rising verified-news momentum and improving technical conditions, or track a defined sector for unusually fast changes in sentiment. The narrower the first screen, the easier it is to learn what the data is actually telling you.
Next, define a baseline. Decide what normal attention, normal volume, and normal sentiment look like for the universe you track. Absolute numbers without a baseline often create misleading results. Then rank candidates by the change that matters most to your workflow and use secondary factors to confirm or reject them.
Keep the final output small. A screen that surfaces ten well-contextualized names is more useful than one that produces hundreds of loosely related results. Each result should answer three questions quickly: What changed? How quickly did it change? What evidence supports it?
The strongest stock screener API workflow does not attempt to predict every market move. It creates a disciplined way to notice shifts earlier, verify them faster, and focus attention where the signal is strongest.