
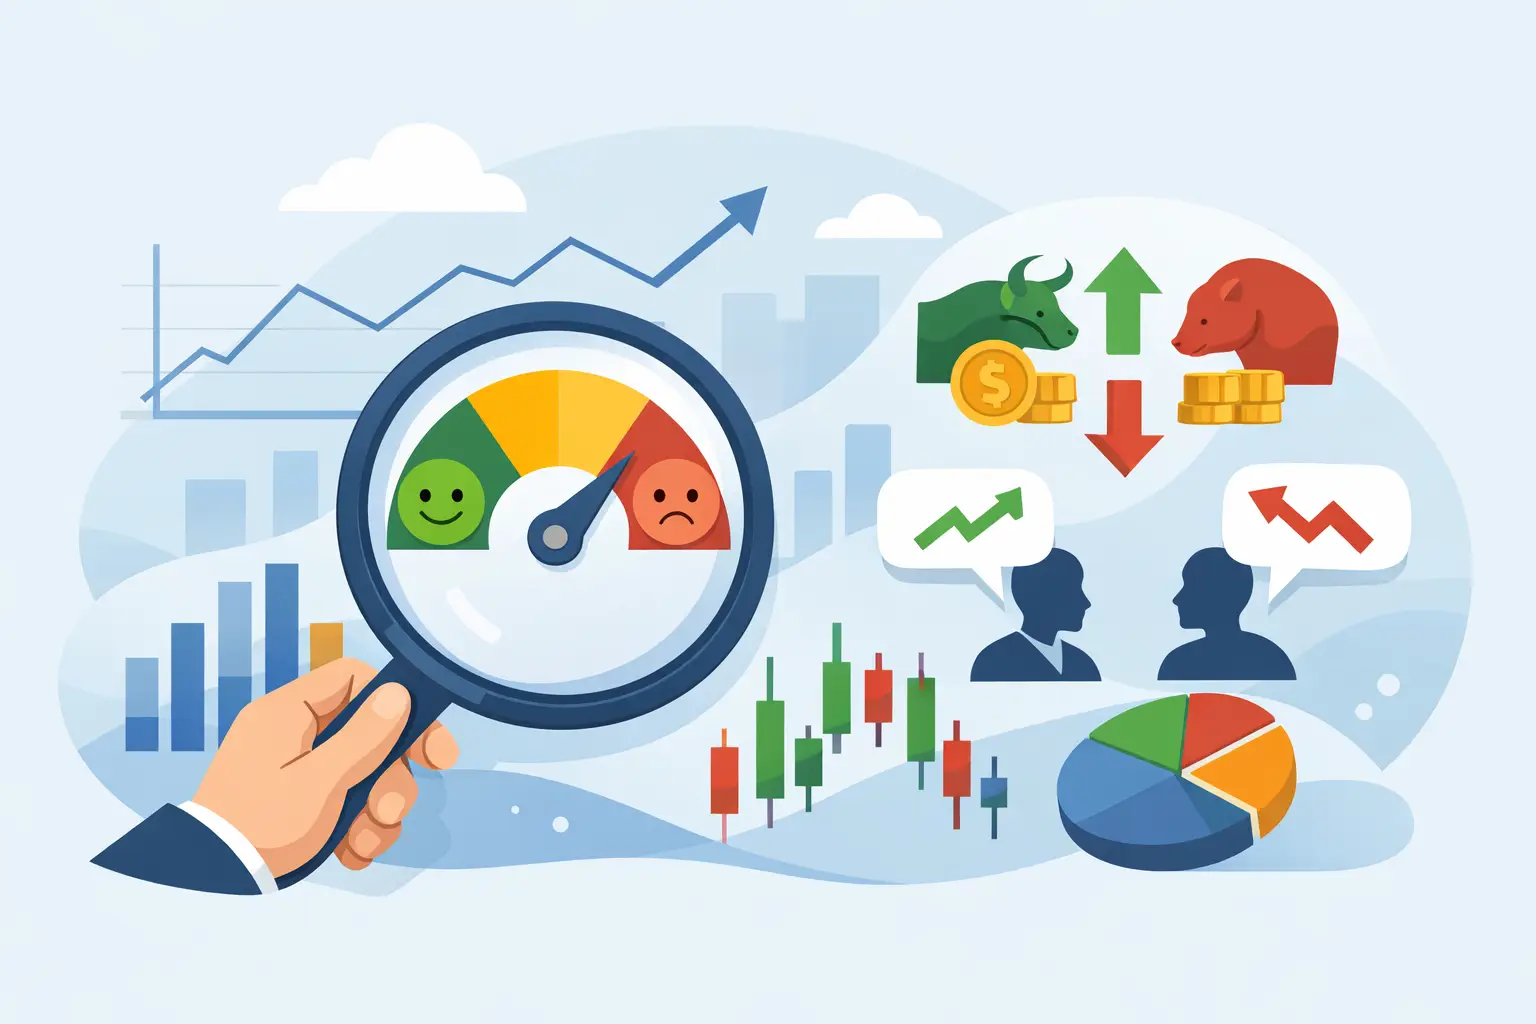
A ticker can look quiet on a price chart while the narrative underneath it is accelerating. A market sentiment analysis tool is built to expose that gap: rising attention, a shift in news tone, unusual discussion volume, or renewed conviction before those inputs become obvious in price and volume. For active market participants, that is not a novelty. It is a faster way to focus research.
The challenge is that raw attention is cheap. A viral post, recycled headline, or coordinated burst of chatter can create the appearance of momentum without producing a durable market narrative. Useful sentiment analysis does not merely count mentions. It separates signal sources, measures their direction and velocity, and places them against technical context.
What a Market Sentiment Analysis Tool Should Measure
Market sentiment is the aggregate posture of participants toward a ticker, sector, or broader theme. It can be optimistic, defensive, uncertain, or rapidly changing. But the market does not express that posture through one channel. It shows up through social conversation, credible reporting, analyst and company-related developments, options interest, and price behavior.
A capable market sentiment analysis tool treats those inputs as distinct evidence streams rather than forcing them into a single, opaque score. Social activity answers one question: where is attention moving? Verified news answers another: what credible catalyst or development is driving the conversation? Technical data provides the market's response: is participation showing up in trend, relative strength, liquidity, or volatility?
That separation matters because the same headline can create very different setups. A ticker with rising social interest but weak news support and deteriorating technical structure deserves a different level of scrutiny than one with accelerating news momentum, broadening discussion, and confirmed relative strength. The goal is not to make sentiment a substitute for analysis. The goal is to make analysis faster, more evidence-based, and easier to prioritize.
Direction, velocity, and abnormality
The direction of sentiment is only the starting point. Traders also need to know how fast it is changing and whether the change is unusual for that specific ticker.
A company that regularly receives heavy discussion has a higher baseline than a lightly covered small-cap name. Ten thousand mentions may be routine for one and a major attention event for another. Good tools normalize activity against historical behavior, helping users identify outliers rather than simply rewarding the most popular names.
Velocity is equally important. A gradual rise in constructive news over several weeks can support a developing multi-session narrative. A sudden spike over 30 minutes may signal a catalyst, but it may also be short-lived. Context determines whether a signal deserves immediate investigation or monitoring.
Why Single-Source Sentiment Fails
Sentiment data is highly vulnerable to noise when it comes from one source. Social feeds move quickly, but they can amplify rumors, stale information, and emotional reactions. News feeds provide greater verification, but a headline alone does not reveal whether attention is broadening or whether the market is responding. Technical indicators confirm behavior, but by themselves they can lag the narrative that initiated the move.
The edge comes from convergence.
When verified news momentum rises, social discussion expands, and technical participation improves, the case for deeper research becomes stronger. When those inputs disagree, the disagreement is useful too. A sharp social spike without credible news may be speculation. Strong news without market follow-through may indicate limited conviction, already-priced expectations, or a broader risk-off environment.
This is why composite scores need transparent evidence behind them. A number can help rank a watchlist, but it should not hide its ingredients. Serious users need to see the articles, discussion trends, timeframes, and technical conditions that produced the signal. Transparency makes it possible to challenge a signal rather than blindly react to it.
A Practical Workflow for Finding Emerging Narratives
The most effective use of sentiment intelligence is not watching a single dashboard all day. It is building a repeatable workflow that narrows a large market into a manageable research queue.
Start with a market-wide or sector-level screener. Look for tickers showing unusual changes in attention, news momentum, or sentiment direction. The focus should be change, not just absolute popularity. A sudden expansion in credible attention often matters more than a name that has remained constantly discussed.
Next, inspect the evidence feed. Identify what is actually driving the shift. Is there a verified development, an earnings-related narrative, a product event, a regulatory item, or broad sector rotation? Check whether the information is new, whether multiple credible sources are covering it, and whether the discussion is building on facts or repeating assumptions.
Then bring in the chart. Technical context helps define whether market participation confirms the narrative. Review trend direction, volume behavior, volatility, key levels, and relative performance. Sentiment is strongest as a research trigger when it is paired with a disciplined process for evaluating market structure.
Finally, track the narrative over time. The first alert is rarely the whole story. Some narratives strengthen as new information arrives and attention spreads. Others fade quickly once the initial reaction passes. A timeline of sentiment, news, and technical changes shows whether conviction is building, peaking, or unwinding.
Alerts Matter More Than More Data
Information overload is not solved by adding another feed. It is solved by defining what deserves interruption.
Custom alerts should be tied to meaningful changes: a sentiment reversal, a surge in verified news activity, an abnormal increase in social volume, or a new alignment between narrative momentum and technical conditions. A useful alert tells the trader why a ticker surfaced, not just that it did.
The threshold should depend on the strategy and timeframe. A momentum trader may care about rapid intraday attention changes and breakout confirmation. A growth-oriented investor may place more weight on sustained news momentum and the persistence of constructive conversation over days or weeks. The right configuration depends on how quickly decisions are made and how long positions are typically held.
This is also where watchlists become more intelligent. Instead of checking every name with equal effort, traders can rank names by narrative change, set alerts for evidence convergence, and reserve manual analysis for the tickers with the clearest shifts in attention and behavior.
Using Sentiment Without Letting It Drive the Decision
Sentiment is a probabilistic input, not a verdict. It identifies where the market's attention is moving, but it cannot establish valuation, predict every reaction, or remove event risk. Strong sentiment can reverse abruptly. Negative sentiment can become crowded. A compelling narrative can still fail to generate sustained participation.
The practical discipline is to use sentiment for discovery and confirmation, not for unquestioned conviction. Validate the source of the move. Compare current activity with the ticker's normal baseline. Check whether technical behavior supports the narrative. Define risk parameters independently of the score or headline.
It also helps to separate attention from intent. High mention volume does not necessarily mean market participants are aligned. Conversation may be divided, skeptical, or focused on a risk event. Sentiment direction, language quality, source credibility, and momentum across time all matter more than a raw count.
From Dashboard Signals to Systematic Research
For discretionary traders, a visual dashboard can compress a large amount of information into a fast research loop. For quantitative hobbyists and developers, the same logic can extend into custom workflows through structured data and APIs.
The important requirement is consistency. If sentiment, news, and technical factors are delivered with clear timestamps and transparent definitions, they can be tested against a strategy's own universe, holding period, and risk rules. That allows users to evaluate whether a signal is useful for their process rather than assuming a market-wide score applies equally everywhere.
Sentimentick is designed around this evidence-first approach, combining social sentiment, verified news momentum, and technical context at the ticker level. The objective is straightforward: surface the narratives that deserve attention before they become impossible to ignore.
The best signal is rarely the loudest one. Build a process that watches for meaningful change, verifies the catalyst, and checks for market confirmation. That is how sentiment becomes a research advantage instead of another stream of noise.