
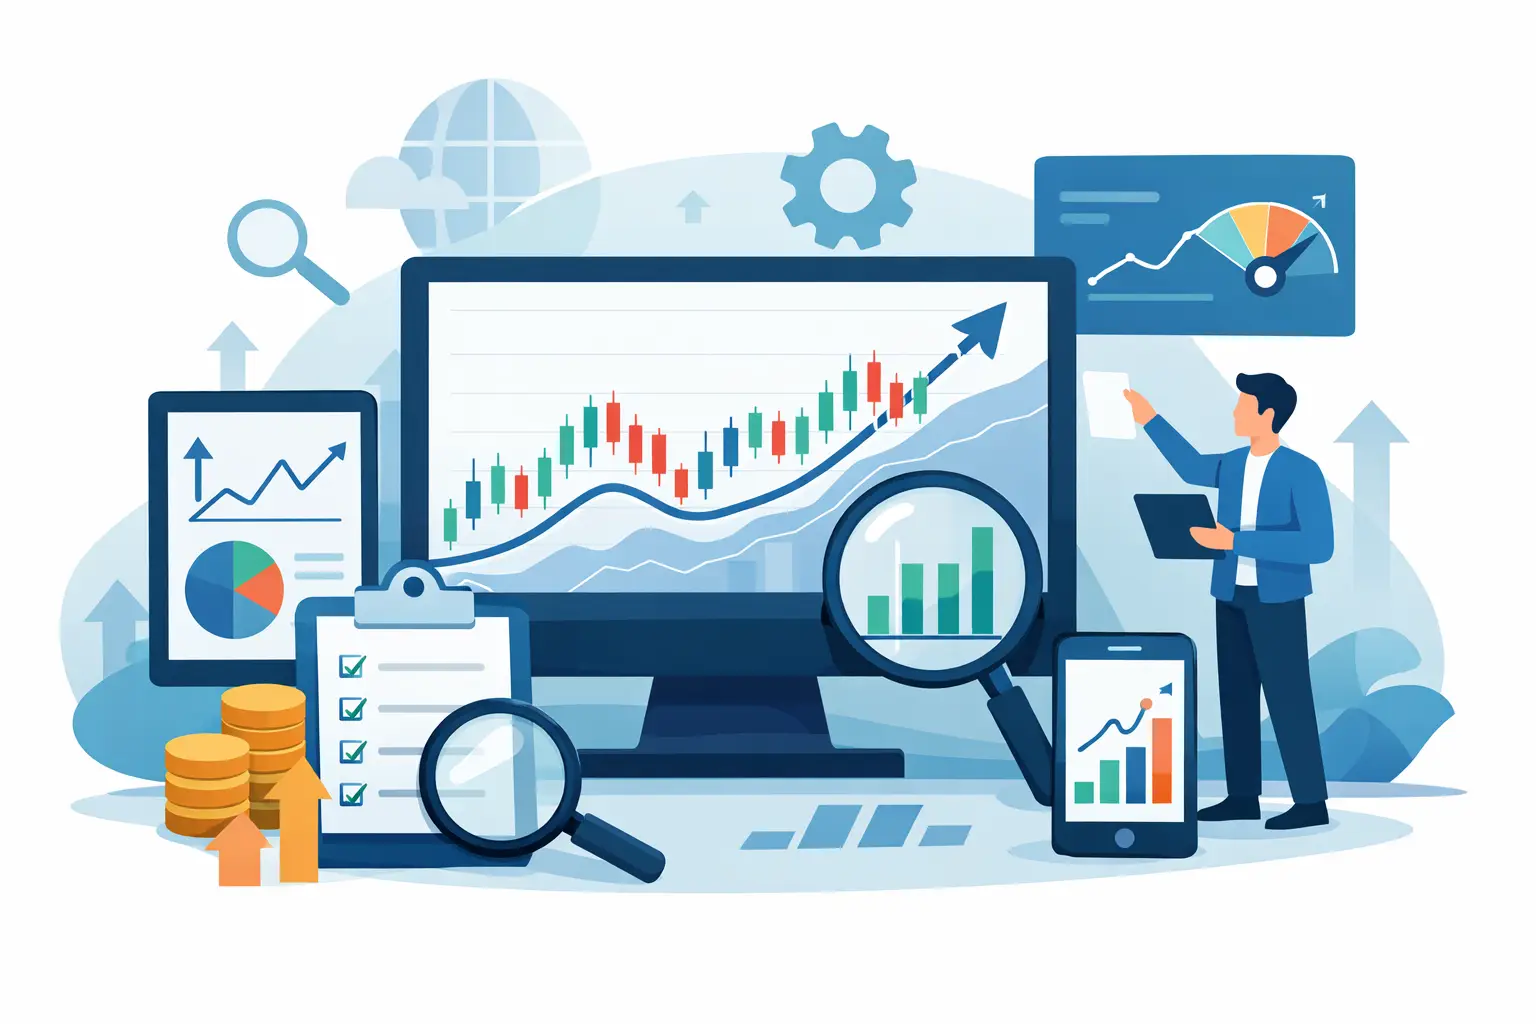
Most market moves do not begin with a clean breakout chart. They begin with a change in attention: a verified headline gains traction, a sector narrative starts spreading, options activity shifts, or a ticker suddenly appears across multiple information channels. The best stock market signal tools help traders detect that transition before price and volume make the move obvious to everyone else.
The operative word is signal. A platform that produces more alerts, more charts, or more data is not automatically more useful. For active market participants, the real standard is whether a tool reduces the time between an emerging development and a research-ready view of what is changing, why it matters, and whether the market is confirming it.
What Makes the Best Stock Market Signal Tools Useful
A market signal tool earns its place in a workflow when it improves one of three things: discovery, validation, or monitoring. Discovery identifies tickers that deserve attention. Validation separates a meaningful catalyst from recycled chatter. Monitoring tracks whether a thesis is gaining confirmation or losing momentum.
Many tools handle one of these jobs well. Fewer connect all three. That distinction matters because isolated signals can be misleading. A spike in social mentions without credible news may be noise. A bullish-looking chart with no expanding attention can stall. A headline without technical confirmation may already be fully reflected in the price.
The strongest systems preserve context. They show the underlying news, posts, technical readings, timestamps, and changes in momentum rather than asking users to trust a black-box score. Speed matters, but evidence matters more. A fast alert that cannot be checked quickly creates a new form of information overload.
Signal quality beats raw alert volume
Alert volume is often confused with market coverage. In practice, a flood of notifications trains traders to ignore the exact event that deserves a closer look. Quality tools filter for unusual activity, accelerating momentum, and cross-channel agreement.
Look for a clear distinction between absolute attention and change in attention. A widely followed large-cap stock may always generate discussion. The more actionable question is whether the rate of discussion, news flow, or technical participation is changing materially versus its own recent baseline.
Evidence should be visible at the ticker level
A score without attribution is hard to use under pressure. Good signal intelligence lets users move from a ranked ticker to the evidence behind the ranking in seconds. That includes the relevant headlines, source quality, social themes, chart context, and the timing of each development.
This is particularly useful when markets are moving quickly. Instead of reacting to a label such as "high sentiment," a trader can determine whether that sentiment is tied to earnings, a regulatory event, product momentum, analyst commentary, sector rotation, or a short-lived viral claim.
The Core Types of Market Signal Tools
No single data source explains the market. A practical research stack combines distinct signal categories, with each one responsible for a specific question.
News momentum tools
News tools track the flow, velocity, and relevance of market-moving information. Their value is not simply faster headlines. The useful layer is identifying when verified coverage is clustering around a ticker or theme and whether that coverage is accelerating.
The trade-off is that headlines can be highly reactive. By the time a major event is broadly reported, the initial repricing may already be underway. News momentum is most useful when paired with historical context, source verification, and a view of whether market participation is expanding after the story breaks.
Social sentiment tools
Social data can reveal attention shifts early, especially around emerging narratives, retail participation, product reactions, and fast-moving event risk. It is also the noisiest input. A high volume of posts may reflect genuine discovery, coordinated promotion, frustration, or repetition of the same unverified claim.
The better approach is to measure sentiment independently from mention velocity and to prioritize source transparency. Users should be able to see what people are discussing, whether the conversation is broadening, and whether verified news is supporting the narrative. Sentiment is a useful early-warning layer, not a substitute for evidence.
Technical signal tools
Technical tools translate price, volume, trend, volatility, and relative strength into a structured view of market behavior. They are valuable because they show whether a narrative has market confirmation. Trend alignment, unusual volume, range expansion, and changes in relative performance can provide critical context around an attention surge.
Their limitation is timing. Technical indicators often describe what price has already done. That does not make them less valuable. It means they work best as a confirmation layer alongside leading indicators such as news and attention momentum.
Screeners and alert engines
Screeners turn a large market universe into a focused research queue. The most effective screeners allow users to combine variables instead of running separate searches for social activity, news, and technical conditions. A signal becomes more relevant when it meets multiple criteria at once.
Alerts extend that workflow beyond the dashboard. They should be configurable by ticker, market condition, score change, theme, or threshold. The goal is not to receive every update. It is to be notified when a monitored condition changes enough to justify renewed research.
APIs for custom research systems
For quantitative hobbyists, developers, and systematic investors, an API changes the role of a signal platform. Instead of manually checking dashboards, users can feed structured sentiment, news, and technical data into proprietary models, internal dashboards, or automated monitoring systems.
API access is not automatically necessary for every trader. It adds setup work and requires a clear use case. But for users tracking broad universes, testing factor relationships, or building repeatable research pipelines, programmatic access can remove a major bottleneck.
How to Evaluate a Signal Tool Before It Enters Your Workflow
Start with the tool's data model. Ask whether social sentiment, verified news, and technical conditions are measured separately or blended into one opaque score. A composite score can be useful for prioritization, but the components need to remain inspectable. Otherwise, users cannot tell what changed or how much confidence to assign to the alert.
Next, evaluate freshness and cadence. Intraday workflows need timely updates and visible timestamps. Medium-term investors may care more about trend persistence, narrative durability, and historical comparison. The right tool depends on the holding horizon, but stale data is a weakness at any horizon.
Then test the platform during a busy session. Can you move from an alert to the evidence quickly? Can you filter a broad list into a small set of relevant candidates? Can you set a watchlist and return later to see what changed? The interface matters because research friction compounds. A powerful dataset hidden behind too many clicks loses value when attention is scarce.
Finally, assess coverage and normalization. A tool should help distinguish a normal level of activity for a heavily watched ticker from a true outlier event in a less-followed name. Raw counts are rarely enough. Relative change, historical baselines, and cross-market context are what turn activity into an interpretable signal.
A Higher-Conviction Signal Workflow
A disciplined workflow begins with broad detection, narrows through evidence, and then follows the evolving setup. Start by screening for unusual combinations: rising news momentum, accelerating social attention, and technical improvement. The combination matters more than any one metric in isolation.
From there, inspect the ticker-level evidence. Read the original sources, identify the dominant narrative, and check whether the activity is new or merely a continuation of an older story. Compare current attention with the stock's normal behavior. A sudden increase in a quiet name may be more informative than another busy hour in an already crowded ticker.
The final step is monitoring. Create alerts around the conditions that would change your assessment: a further acceleration in verified news, a deterioration in sentiment, a break in technical structure, or a shift in sector-level attention. This keeps research active without forcing constant manual surveillance.
Sentimentick is built around this exact sequence, combining independently weighted social sentiment, verified news momentum, and technical analysis in a single ticker-level research environment. The point is not to replace judgment. It is to surface emerging narratives with the evidence needed to assess them quickly.
Where Signal Tools Commonly Fail
The most common failure is treating every anomaly as a tradable event. Markets generate anomalies constantly. Some fade within minutes, while others develop into durable repricing. Signal tools identify changes in conditions; they do not eliminate the need for risk controls, liquidity awareness, and independent research.
Another failure is overfitting to a single source. A trader who relies only on social data can get trapped by attention without substance. Someone who only watches technicals may miss the catalyst that explains a changing chart. Someone who only follows news may see the story but miss whether participation is expanding. The edge comes from triangulation.
The best signal tool is the one that makes this triangulation fast enough to matter. Keep the workflow simple, keep the evidence visible, and focus alerts on changes that genuinely alter your market view. That is how signal intelligence becomes a repeatable research advantage rather than another noisy screen.