Most traders do not miss moves because they cannot read a chart. They miss them because attention shifts before price structure becomes obvious. An abnormal ticker activity scanner exists to catch that earlier phase - when a symbol starts attracting unusual discussion, news flow, or cross-platform interest that has not fully translated into the tape yet.
That matters because modern market moves are often narrative-driven before they are technically clean. A stock can go from ignored to crowded in a few hours, and by the time volume screens light up, the easy context is gone. If your workflow still depends on manually checking feeds, social chatter, and headline bursts one ticker at a time, you are already late.
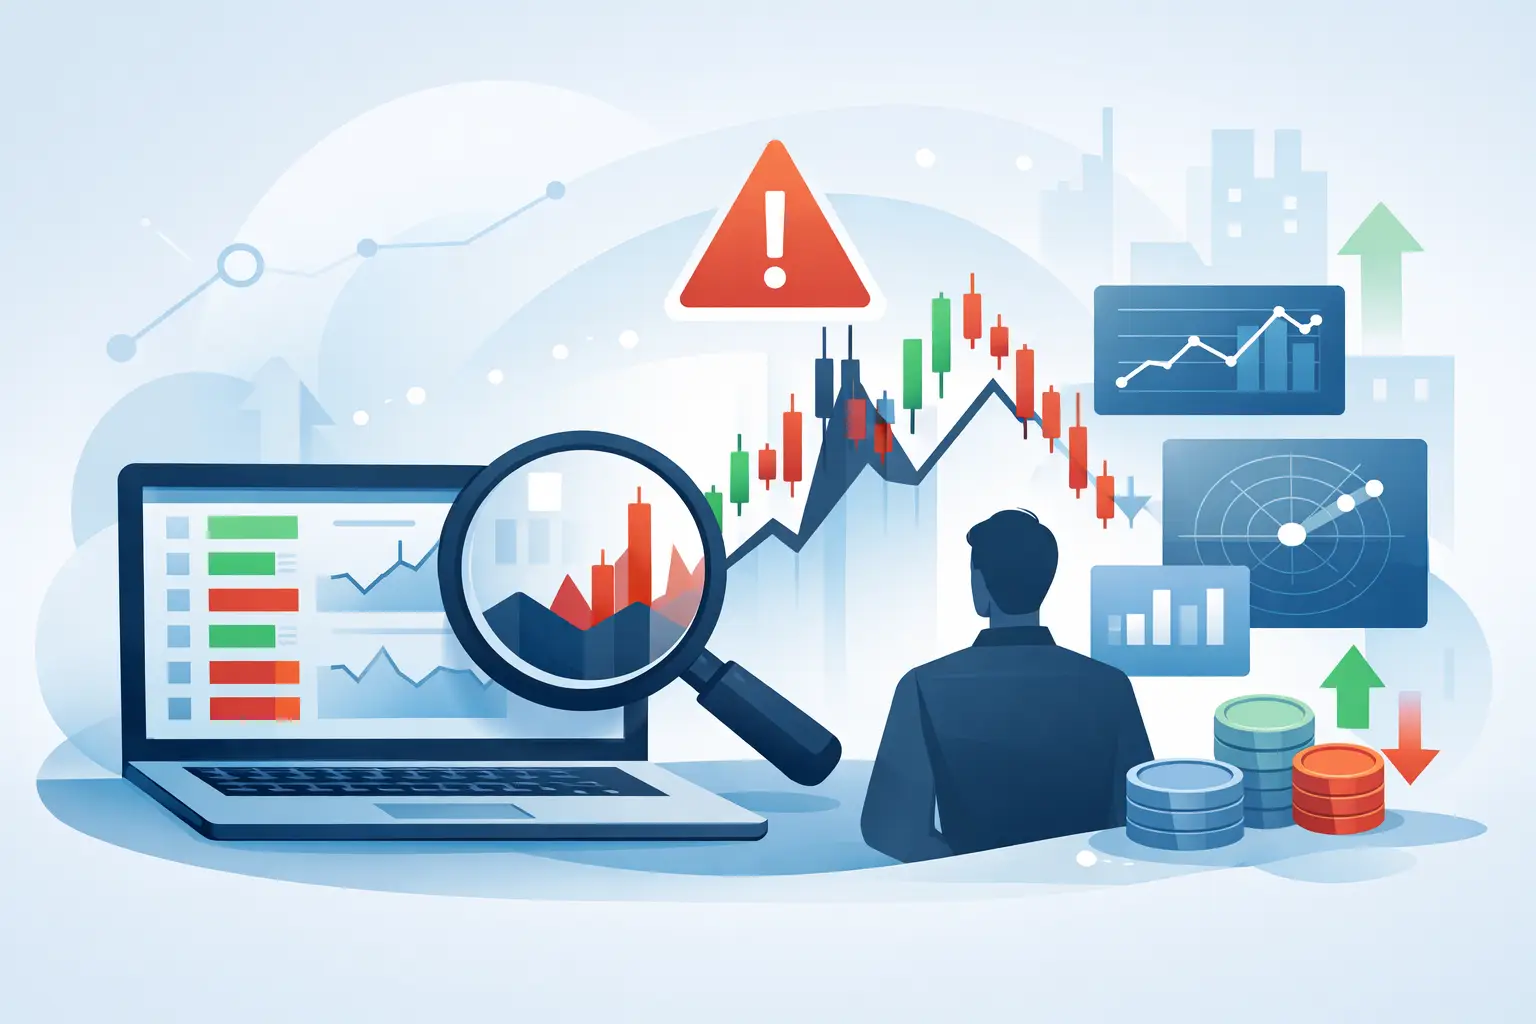
What an abnormal ticker activity scanner actually does
At a practical level, an abnormal ticker activity scanner measures when a stock is receiving more attention than its own baseline. That baseline matters. Fifty mentions might be noise for a mega-cap that lives in the headlines, but highly unusual for a small-cap name that normally gets near-zero coverage.
A useful scanner does not just count mentions. It compares current activity against recent historical norms, separates source types, and tracks whether the increase is broad, concentrated, positive, negative, or mixed. It should tell you not only that attention is elevated, but why that elevation may matter.
In trading terms, the scanner is less about raw popularity and more about outlier detection. You are looking for deviation - sudden changes in interest, sentiment, and narrative intensity that suggest something is starting to develop around a ticker.
Why abnormal ticker activity matters before price confirms
The market does not react to information in a perfectly linear way. First, a headline hits or a narrative catches traction. Then attention spreads across social channels, chat rooms, news desks, and watchlists. Only after that does broader participation often show up in volume and price expansion.
That sequencing is exactly why abnormal activity can be valuable. It gives you a read on market attention at the point where a story is forming, not just after the move has become obvious to everyone scanning candles and relative volume.
This does not mean every attention spike leads anywhere. Many do not. Some are false alarms, recycled rumors, or low-quality social bursts that fade within minutes. That is the trade-off. The earlier you want the signal, the more noise you have to filter.
The edge comes from identifying which spikes have structure behind them. Is there verified news attached? Is sentiment broadening or collapsing? Is the same ticker being discussed for one reason across sources, or for ten unrelated reasons? Those details separate useful abnormal activity from random chatter.
What to look for in an abnormal ticker activity scanner
An effective abnormal ticker activity scanner should start with context, not just alerts. If a platform only tells you that mentions are up, it is giving you a fragment of the picture.
The first thing to look for is source separation. Verified news momentum and social attention should not be blended into one score without visibility. They behave differently and carry different weight. A ticker with rising news velocity and modest social discussion has a different profile than one exploding on social with no credible reporting behind it.
Second, the scanner should work off relative abnormality, not absolute counts alone. A stock trending from 5 mentions to 100 is often more interesting than a stock moving from 5,000 to 5,200. Outliers live in the rate of change versus normal behavior.
Third, you need evidence. A serious workflow does not stop at a colored signal. You want to inspect the underlying posts, headlines, and discussion themes that pushed the ticker into abnormal territory. That is how you validate whether the move is tied to earnings, litigation, analyst commentary, sector rotation, retail crowding, or pure rumor.
Fourth, narrative tracking matters. Not all abnormal activity is one event. Sometimes the same ticker persists because the story is evolving over several sessions. In those cases, the scanner should help you see whether conviction is building, fragmenting, or reversing.
How traders actually use this signal
For active traders, an abnormal ticker activity scanner is usually not the final decision tool. It is the front end of the research process. Its job is to compress the market into a smaller set of names worth immediate attention.
One common use case is pre-move discovery. You scan for tickers showing unusual discussion or headline acceleration before they become top volume leaders. That gives you time to assess whether the market is early, justified, or simply noisy.
Another use case is validating a move already underway. If price is expanding but attention metrics remain flat, the move may be less crowded than it appears. If both price and abnormal activity are rising together, you are seeing stronger alignment between tape action and market focus.
It also helps with watchlist triage. Most traders do not have a stock-picking problem. They have an attention management problem. On any given day, there are too many symbols, too many headlines, and too much recycled commentary. A scanner narrows the field by surfacing where attention is behaving abnormally right now.
For developers and quantitative users, the scanner becomes a structured input. Instead of scraping feeds manually or hand-tagging stories, they can work with ticker-level abnormality data, sentiment shifts, and evidence trails in a repeatable way. That is especially useful when building custom dashboards or research pipelines around emerging market narratives.
Abnormal ticker activity scanner vs. basic momentum scanning
A standard momentum scanner focuses on what has already appeared in the market data - price change, volume expansion, range extension, gap percentage. That remains useful. But it is downstream from attention.
An abnormal ticker activity scanner looks earlier in the chain. It asks whether people are suddenly paying attention to a stock, whether the conversation is intensifying, and whether the reason for that attention is credible or unstable.
Neither tool replaces the other. In practice, they work best together. Momentum screens show what the tape is doing. Abnormal activity screens show what the market is noticing and discussing. When both line up, the signal tends to be clearer. When they diverge, the setup needs more scrutiny.
This is also where nuance matters. A ticker can have strong abnormal activity and go nowhere if the story lacks follow-through. Another can move hard with limited chatter because the catalyst is already understood by institutions before social discussion catches up. There is no single read that works in every regime.
The real challenge: filtering signal from noise
The biggest weakness in this category is not data availability. It is data quality. Plenty of tools can count mentions. Far fewer can distinguish viral nonsense from meaningful market context.
That is why weighting matters. Verified reporting, source credibility, post velocity, duplication, and narrative consistency all influence whether an activity spike deserves attention. If a scanner treats every mention equally, it will overwhelm you with garbage during high-noise sessions.
A stronger system surfaces abnormality with enough structure to support a fast judgment call. You should be able to see whether the spike is news-led, socially led, or mixed. You should be able to inspect evidence immediately. And you should be able to tell whether the ticker is experiencing a one-off burst or sustained narrative momentum.
This is the difference between a curiosity tool and a trading workflow tool. One creates more tabs. The other reduces decision lag.
Where a platform like this fits in a modern workflow
For traders who track market attention seriously, an abnormal ticker activity scanner fits best at the top of the funnel. It is the system that flags what changed, so you can spend your time evaluating relevance instead of hunting for it.
That is especially true when the platform separates verified news from social sentiment and tracks the narrative around each ticker over time. Sentimentick is built around that exact problem: helping traders catch unusual attention early, inspect the evidence behind it, and monitor whether the story is strengthening or breaking apart.
The practical value is speed with context. Not speed alone. Speed without filtering just gives you more noise faster.
A better way to think about abnormal activity
The phrase sounds technical, but the idea is simple. Markets move when attention concentrates. An abnormal ticker activity scanner helps you measure that concentration before it is fully reflected in the obvious places everyone watches.
Used well, it does not replace chart work, news reading, or ticker-specific research. It sharpens all three by telling you where the narrative pressure is building first. That is often the difference between reacting to a move and recognizing the setup while it is still forming.
If your process still starts with yesterday's leaders, you are screening for what already happened. A sharper process starts by asking a better question: which tickers are becoming impossible for the market to ignore right now?